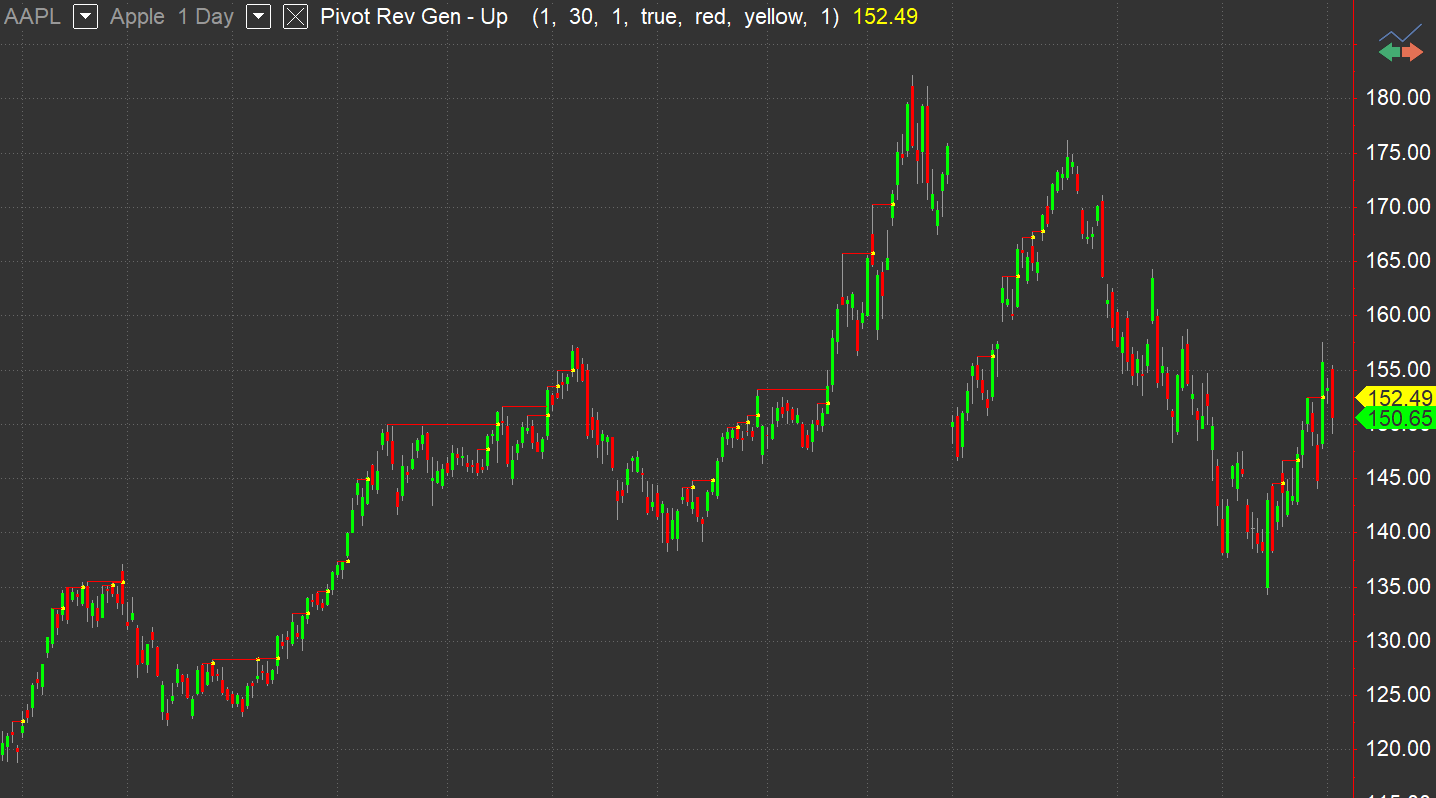
Pivot Rev Gen - Up
Pivot points are used to determine support and resistance levels. The resistance level may be identified by high pivots, whereas low pivots spot the support level.
When the price crosses above resistance level or below support level, a breakout occurs and a major price movement may be expected.
Pivot Rev Gen – Up determines if any price of the current bar breaks any previous “significant” Pivot High point that has not been broken. A Pivot High is considered significant if its Right Strength is inside the range defined in MinRStren and MaxRStren inputs and its Left Strength is greater than Right Strength multiplied by LRFactor input value. If LRFactor input is set to 0, Left Strength must be greater than or equal to MinRStren.
A yellow dot is placed on the current bar at the identified Pivot High price and a horizontal line is optionally drawn from the original Pivot High point to the current bar.
In the Scanner the Pivot High price value is displayed in the indicator cell.
Default Inputs
MinRStren (1) - minimum right strength range value.
MaxRStren (30) - maximum right strength range value.
LRFactor (1) - multiplier for calculation of the left strength based on the right strength.
DrawLines (True) - defines if a connecting line is drawn from the previous Pivot High point to the current bar.
LinesColor (Red) - color of the horizontal marker.
PlotColor (Yellow) - color of the Pivot High points.
ColorScheme (1) - defines the Pivot High plot color on the chart and cell appearance in the scanner. 0 - no coloring; 1 - color the Pivot High points on the chart and the Pivot High price value in the Scanner; 2 - color the cell background in the Scanner.