Pre-Scanning and Watchlist
The fact that some data providers have a limitation on number of simultaneous real-time data subscriptions made scanning numerous markets almost impossible. Market Scanner allows managing sets of instruments in both Real-Time and Historical request modes at the same time.
Contents
Market Scanner
A Scanner window with all the settings is always created and then being saved in a Workspace. The number of windows that can be added to workspaces is limited only by computer's hardware configuration.
- To create a new Scanner window:
- Click on the New Scanner Window
 icon on the Main Toolbar, or
 - Select File in the main menu, then point to New and click on New Scanner Window, or
- Use CTRL+SHIFT+INSERT hot key combination, or
- Right-click on the empty area of the workspace and select Scanner Window.
When Scanner Window is opened for the first time, a Watchlist field is shown by default.
To open Pre-Scanning click the SHOW Pre-Scanning text at the top of the Scanner Window.
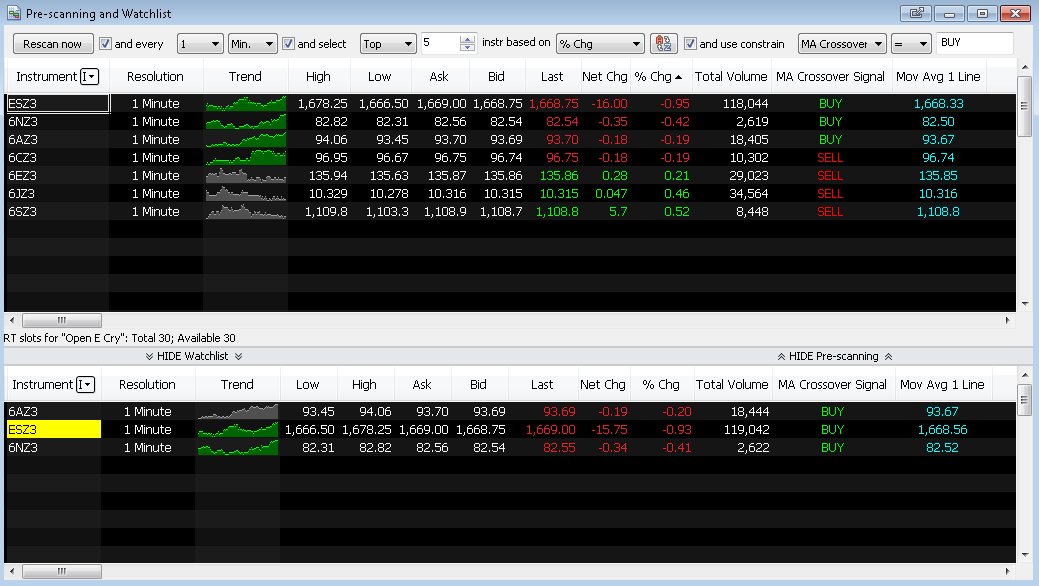
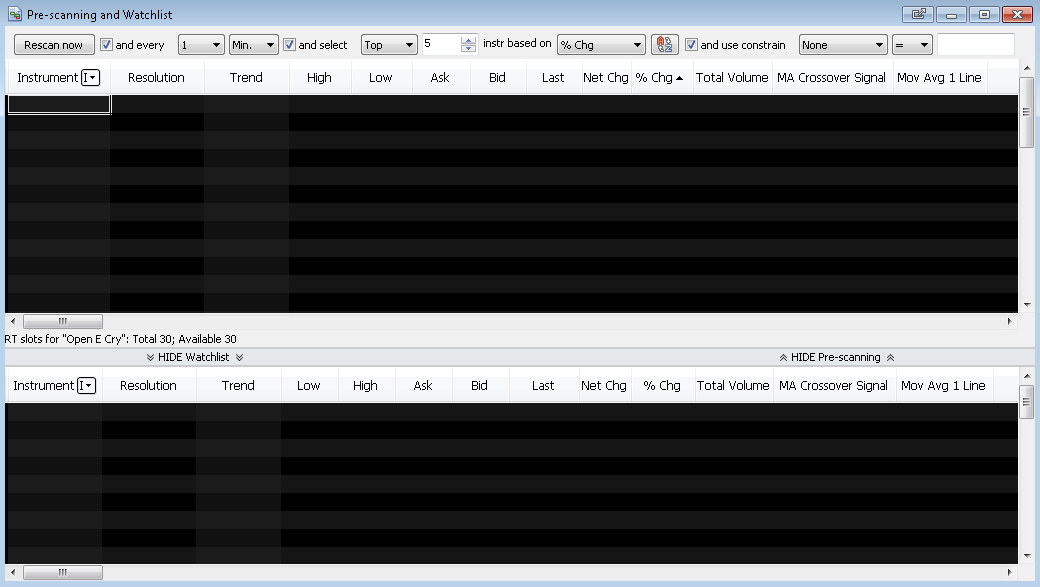
- The new scanner concept contains of two parts (see screenshots below):
- Watchlist (bottom window) that is a standard version of MultiCharts Scanner;
- Pre-Scanning (top window) that requests historical data after a certain time interval pre-set by a user. This data can be analyzed in accordance with the pre-set scan filters and the instruments that satisfy the conditions can be copied into the Watchlist window for observing their movement in real-time.
Setting up scanning criteria
Scanning Criteria toolbar
Scanning criteria is to be set with the Criteria toolbar at the top of the Scanner Window.
- Rescan now / Stop Scan button.
- Every check box,
- Time period selector,
- Min/Hr selector,
- Select checkbox,
- Top / Bottom selector,
- Instruments to copy selector,
- Criteria list,
- Sort in ascending/descending order button,
- Use Constrain Condition ceckbox,
- Comparison type list,
- Compared value input field.
Selection of Scanning Criteria
Criteria toolbar represents a statement with adjustable clauses that allow customization of the scanning criteria:
- and every checkbox enables repeating of the historical scanning after the set period of time.
- After checking this checkbox, select the time period from the Time Selector lists. This time period will be shown in the status line of the scanner window as a countdown.
- and select checkbox. When checked, all the instruments that satisfy the scanning conditions will be copied from Pre-Scanning part of the Scanner into the Watchlist part of the Scanner. The appropriate instruments will be copied only when historical calculation is complete.
- After checking and select checkbox, select the number of result instruments to copy from historical part into a real-time one.
- Select either the best or the worst scanning results will be selected with Top / Bottom selector. Top - the best results, bottom - the worst results will be copied.
- and use constrain checkbox. When checked a constrain condition will be applied. This condition is designed to compare the prices and indicator values with the pre-set ones.
- After checking and use constrain checkbox select a price or indicator value, comparison type and compared value.
Starting Scanning
When instruments are added into Pre-Scanning Part of the Scanner Window and the scanning criteria is set, scanning can be started. To start scanning click the Rescan now button.
Rescan now button initiates historical data requests. The data is requested partially depending on the limitation of the data source thus the data is received for a numerous instruments without breaking the limitations of data source.
Once Rescan now button is clicked, it changes to Stop Scan. At this moment, historical data request is sent for the number of the instruments added into the historical part of the scanner window. As soon as all the historical data is obtained, instruments will be unsubscribed from the data source and data will be requested for the next set of instruments. The results are evaluated by the scanning criteria and satisfying instruments are copied into the Real-Time part of the scanner window.
Scanner Window Status Line
Status line shows:
- Total number of available Real-Time data subscriptions,
- Note: Number of Real-time data subscriptions depends on the data source. For most of the data sources it is set by default to 30
- Available number of Real-Time data subscriptions left,
- Data source name
- If and every checkbox is enabled historical scanning will be repeated in the set period of time. In this case, the countdown until the next scan will be shown in the Scanner Window status line.
Working with Scanner in offline mode
In order to speed up the process of historical scanner backfill in offline mode the instrument will be unsubscribed after either complete historical data backfill or after a certain timeout thus letting the other instruments be backfilled sooner.


