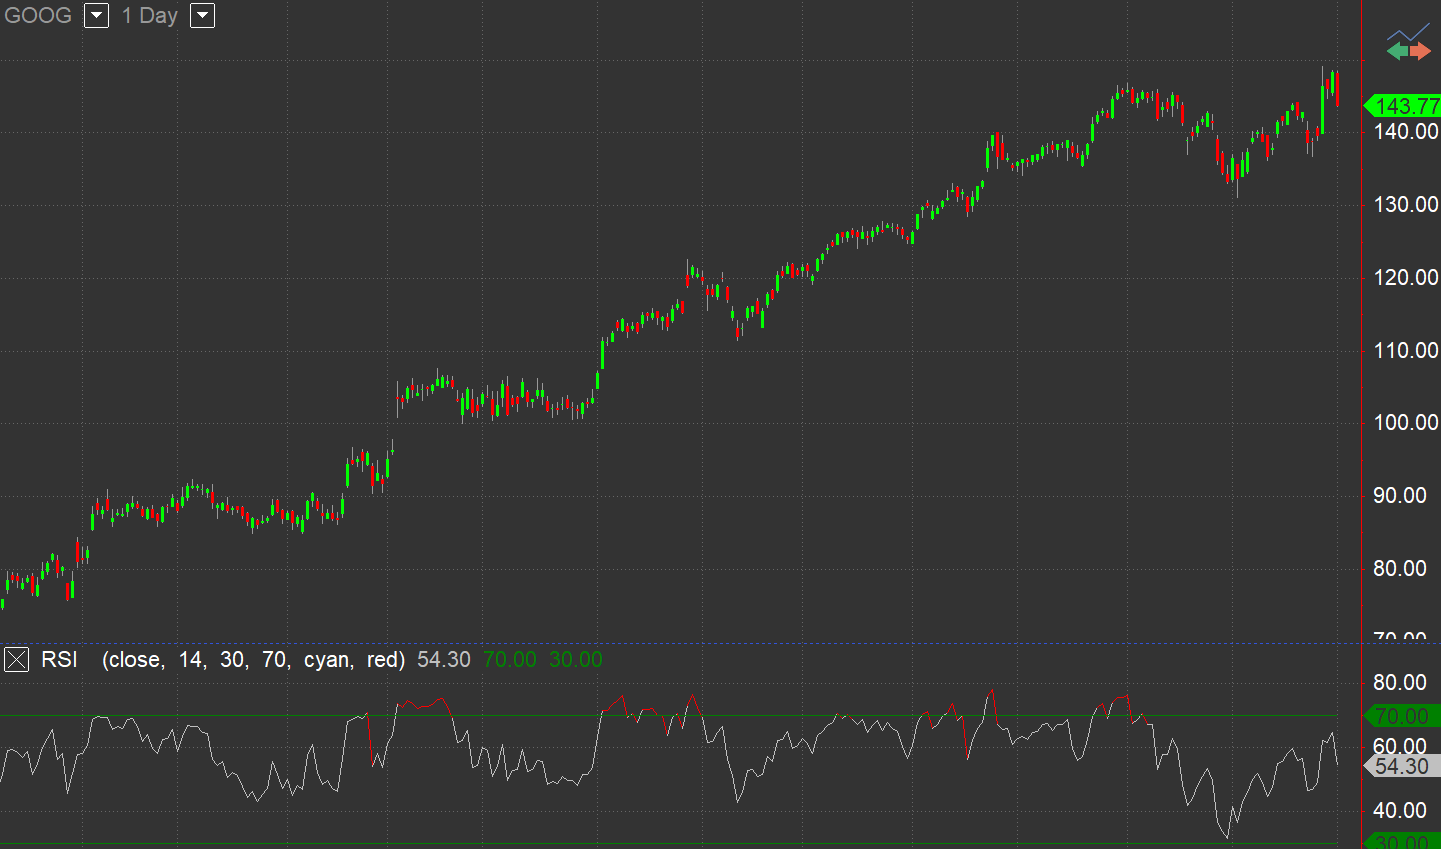
RSI
The Relative Strength Index (RSI) is a well versed momentum based oscillator which is used to measure the speed (velocity) as well as the change (magnitude) of directional price movements. The indicator determines a value based on the cumulative strength and weakness of price, set in the input Price, over the period set in the input Length. RSI gathers the points won on bars with higher closes and the points lost on bars with lower closes. The index of these two sums is plotted on the chart.
RSI operates between a scale of 0 and 100. The closer RSI is to 0, the weaker the momentum is for price movements. The opposite is also true. An RSI closer to 100 indicates a period of stronger momentum.
The indicator provides a visual mean to monitor both the current, as well as historical, strength and weakness of a particular market. RSI has proven to be a viable indicator of price movements.
Also, RSI is helpful to recognize turning points in case of non-confirmations or divergences. For instance, one can detect a false breakout if a new high in price happens without a new high in RSI. RSI can also help to determine overbought and oversold conditions when the RSI value reaches extreme highs or lows. This indicator automatically changes the color of the RSI plot when it exceeds either of the levels specified in the inputs OverSold and OverBought. Horizontal reference lines are also plotted at these levels as visual aids.
Default Inputs
Price (close) sets the price used in calculation of RSI.
Length (14) sets the number of bars to include in the calculation.
OverSold (30) sets the RSI level considered as oversold.
OverBought (70) sets the RSI level considered as overbought.
OverSColor (cyan) sets the color used when RSI is below the OverSold level.
OverBColor (red) sets the color used when RSI is above the OverBought level.