Stochastic Slow
Stochastic Slow calculates the position of the current price in relation to its range over a number of the most recent bars (specified in StochLength input).
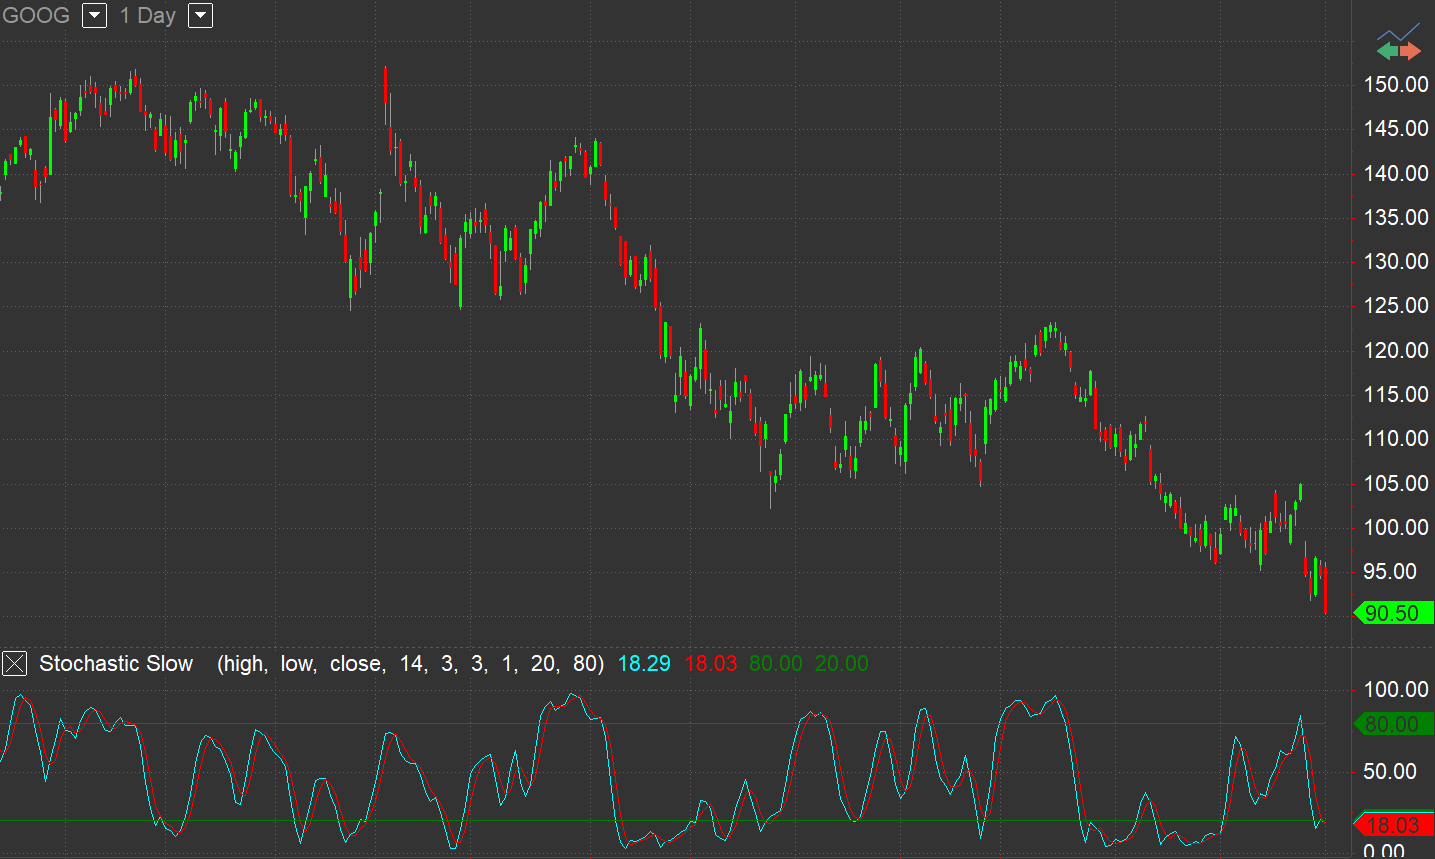
The calculated values are further indexed and SlowK is plotted. SlowD is plotted as the smoothed average of SlowK. SlowK and SlowD plot as oscillators with values from 0 to 100.
The Stochastics plot direction may be used to define price movement. For example, rising Stochastics may be a sign of rising prices. Stochastics may also help to determine turning points when there are divergences. For example, a new high in price without a new high in Stochastics may indicate a false breakout. Stochastics are also useful for overbought and oversold conditions when the Stochastics reach extreme highs or lows.
Default Inputs
PriceH (High) - price value used as the upper end of range for SlowK calculation.
PriceL (Low) - price value used as the lower end of range for SlowK calculation.
PriceC (Close) - price value used as the the current price for SlowK calculation.
StochLength (14) - number of bars included in calculation of SlowK.
SmoothingLength1 (3) - number of bars for slowing SlowK to SlowD.
SmoothingLength2 (3) - number of bars for slowing SlowD to SlowK.
SmoothingType - 1 = original, 2 = legacy.
MedLength (9) - number of bars included in calculation of the "medium" average.
OverSold (20) - oversold SlowK level.
OverBought (80) - overbought SlowK level.
Plots
Plot1 (SlowK, Cyan) - SlowK value.
Plot2 (SlowD, Red) - SlowD value.
Plot3 (OverBot, Dark Green) - overbought level reference line.
Plot4 (OverSld, Dark Green) - oversold level reference line.