Stochastic SlowK
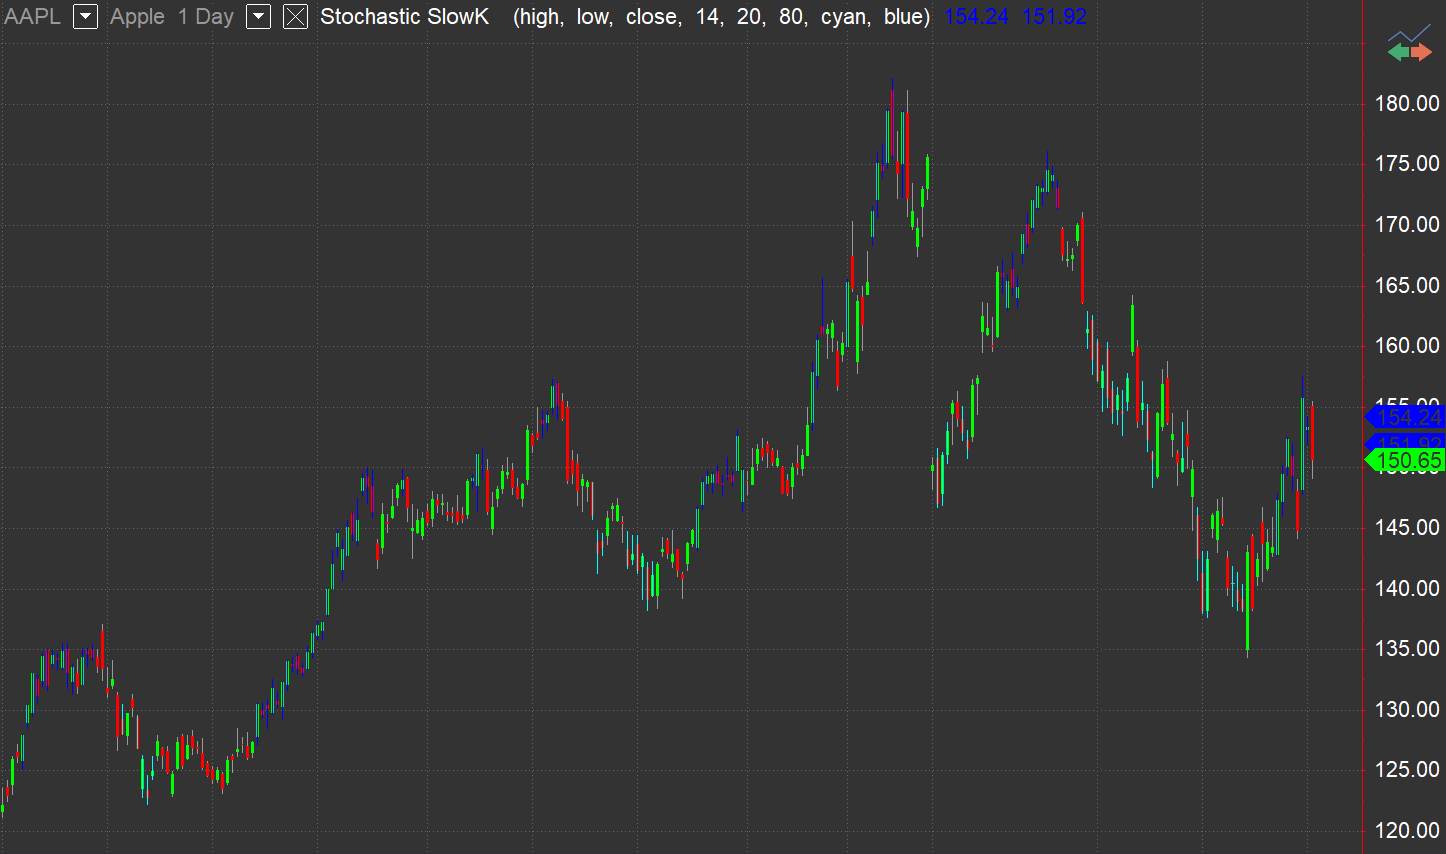
Stochastic SlowK paints the bars during which the market is considered overbought in cyan, and the bars during which the market is considered oversold in blue.
The indicator calculates a Stochastic Slow value (SlowK) using the price values indicated in PriceH, PriceL and PriceC input for the number of bars specified in Length input. When Stochastic Slow value goes under the value specified in OverBought input, the market is considered overbought. When Stochastic Slow value is above the value in the OverSold input, the market is considered oversold.
Default Inputs
PriceH (High) - High value used for slow Stochastic value calculation.
PriceL (Low) - Low value used for slow Stochastic value calculation.
PriceC (Close) - price value compared to high and low values during slow Stochastic value calculation.
Length (14) - number of bars included in slow Stochastic value calculation.
OverSold (20) - the level at which market is considered oversold.
OverBought (80) - the level at which market is considered overbought.
OverSColor (cyan) - bar color when the oversold conditions are met.
OverBColor (blue) - bar color when the overbouhgt conditions are met.