Ultimate Osc
Definition
The Ultimate Oscillator is a technical indicator that is used to measure the price momentum across three varying timeframes.
It was developed by Larry Williams in 1976.
Unlike other momentum oscillators that rely on a single timeframe, the Ultimate Oscillator indicator has less volatility and fewer trade signals. The Ultimate Osc is that it is a way to measure buying pressure. When buying pressure is strong, the Ultimate Osc rises and when buying pressure is weak, the Ultimate Osc falls. The calculation for the Ultimate Osc takes into account three separate timeframes. Al these timeframes are weighted accordingly - it gives the most weight to the shortest time frame, yet it still factors in the longest timeframe.
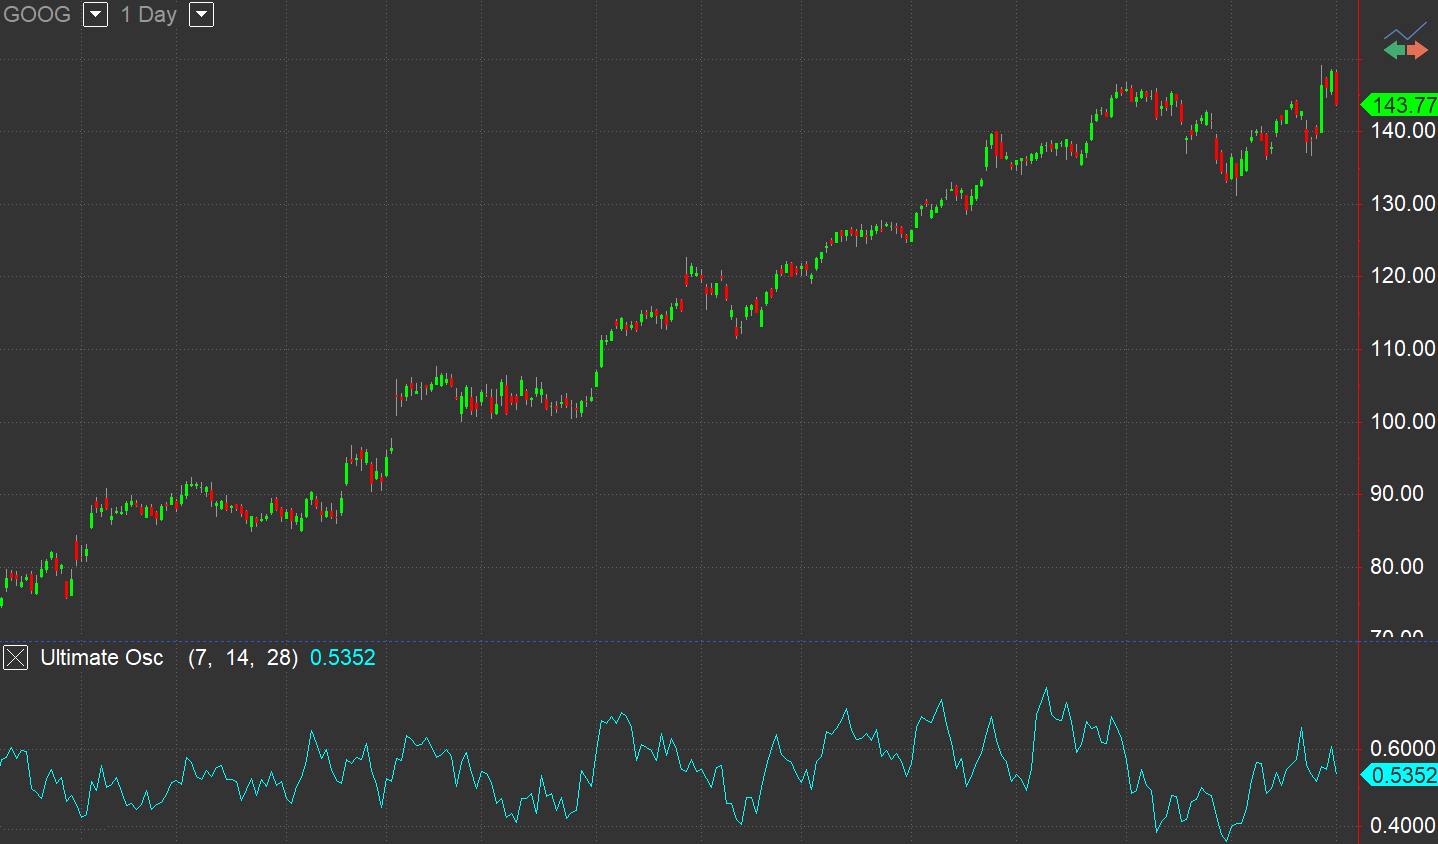
The indicator uses three timeframes in its calculation: seven, 14, and 28 periods.
The Ultimate Oscillator is a range-bound indicator with a value that fluctuates between 0 and 100. Similar to the Relative Strength Index (RSI), levels below 30 are deemed to be oversold, and levels above 70 are deemed to be overbought. Trading signals are generated when the price moves in the opposite direction as the indicator, and are based on a three-step method.
Default Inputs
FastLength sets the length of the 1st time period, 7 by default.
MedLength sets the length of the 2nd time period, 14 by default.
SlowLength sets the length of the 3rd time period, 28 by default.