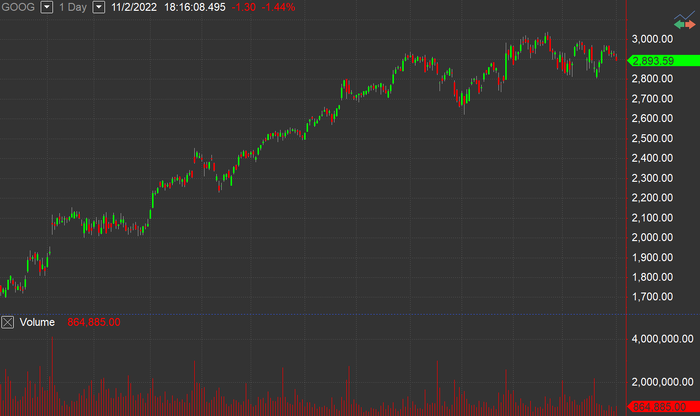
Volume (Indicator)
The Volume indicator measures how much of a given financial asset has traded in a specific period of time. Volume is measured by shares traded for stocks, whereas for futures, it is based on the number of contracts. Traders who use volume-based indicators are able to use the tool to their advantage in understanding the strengths of advances and declines in stocks as well as in markets in general. Volume is great for studying trends, with many ways to use the indicator. All in all, it helps identify market strength or weakness and can confirm price moves where they might point to a reversal.
If the indicator is applied to a chart with the daily resolution or greater (Day, Week, Month, Quarter, Year) it plots values of the Volume keyword. The indicator displays Ticks values if it is used on non-standard chart types or the resolution is tick or intra-day.
