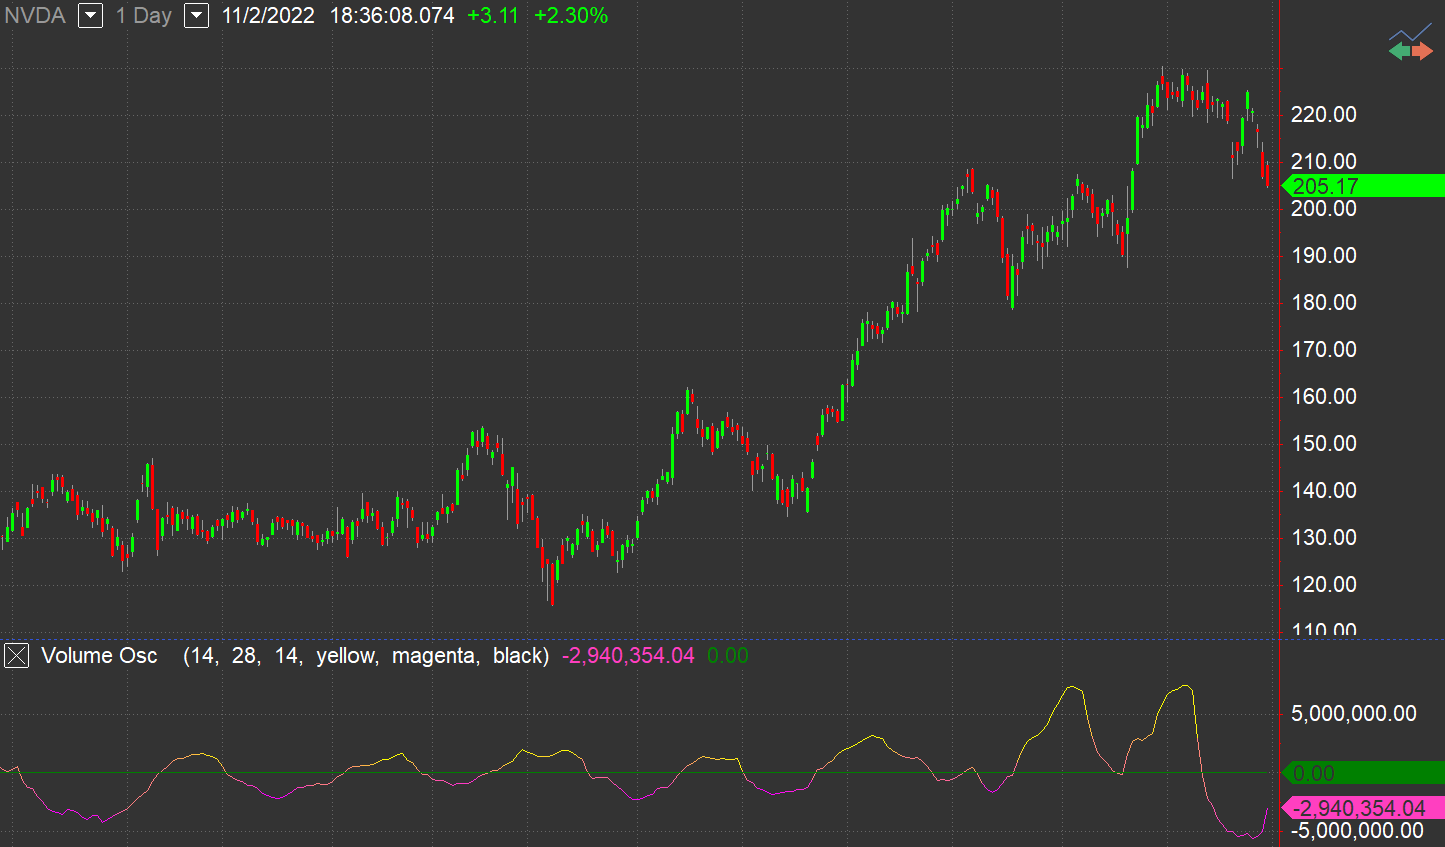
Volume Osc
The Volume Oscillator is a helpful technical analysis indicator that projects the strength or weakness of price trends.
The Volume Oscillator is an indicator made up of two Moving Averages (MA) surrounding volume, one being fast and the other slow. The slow volume MA value is then subtracted from the value of the fast Moving Average. The Volume Oscillator measures volume by analyzing the relationship between the two Moving Averages mentioned.
This indicator displays positive values above the zero line, and negative below. A positive value suggests there is enough market support to continue to drive price activity in the direction of the current trend. A negative value suggests there is a lack of support and prices may begin to become stagnant or reverse.
The Volume Oscillator indicator calculates both a fast and slow volume moving average, which are set at different default settings. The fast volume Moving Average has a default setting of 14, meaning a period of 14 days or weeks. The slow volume Moving Average, on the other hand, has a default setting of 28, meaning a period of 28 days or weeks.
Default Inputs
FastLength (14) sets the number of bars used to calculate the fast volume moving average.
SlowLength (28) sets the number of bars used to calculate the slow volume moving average.
ColorNormLength (14) sets the number of bars over which to normalize the indicator for gradient coloring.
UpColor (yellow) sets the color to use for indicator values that are relatively high over ColorNormLength bars. Set to -1 to disable gradient color plotting.
DnColor (magenta) sets the color to use for indicator values that are relatively low over ColorNormLength bars. Set to -1 to disable gradient color plotting.
GridForegroundColor (black) sets the color to use for numbers in the Scanner cells when gradient coloring is enabled, that is, when both UpColor and DnColor are set to non-negative values.