ZigZag %
From MultiCharts
Definition
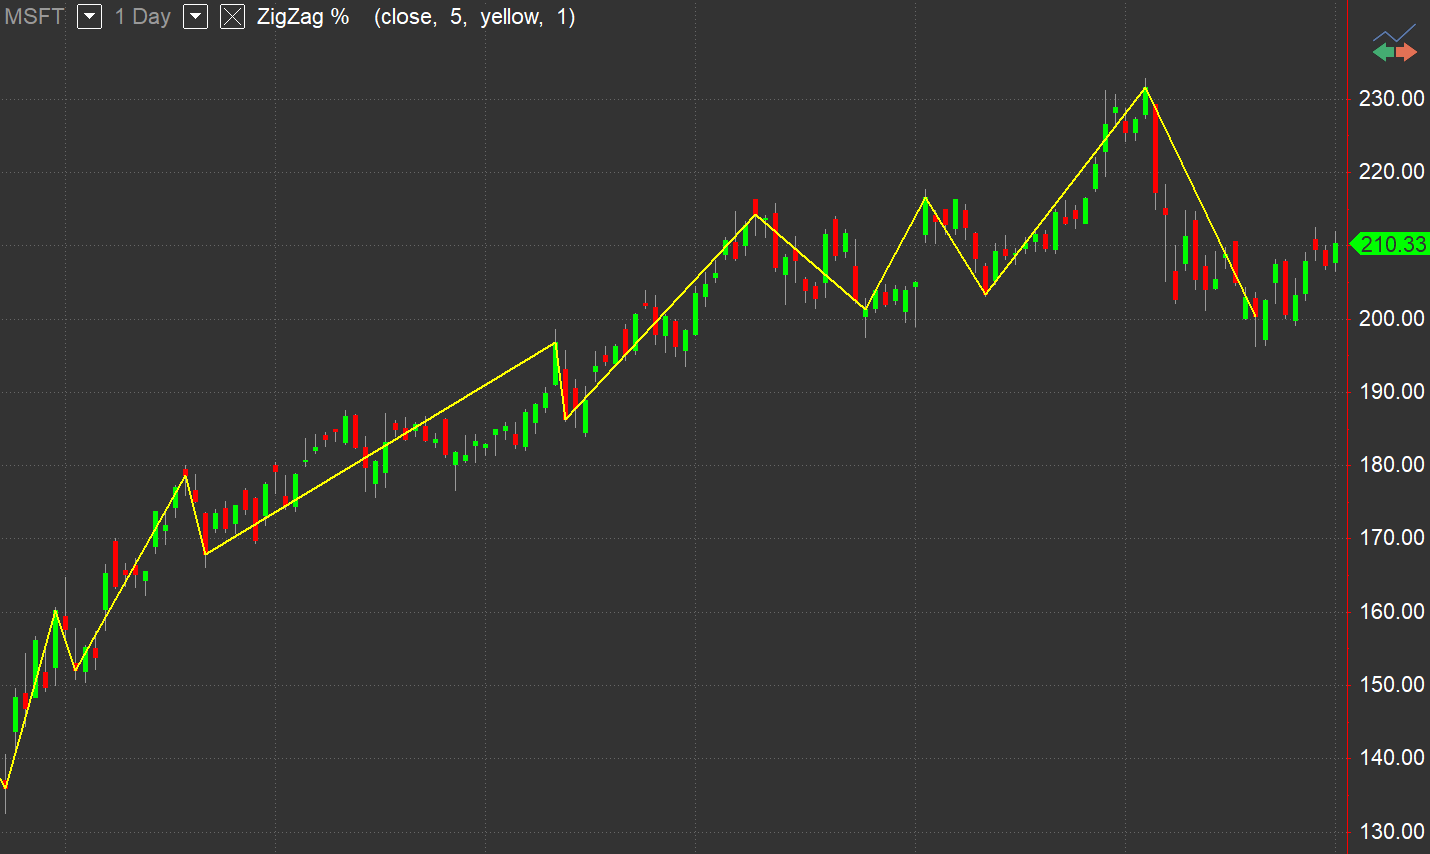
The ZigZag % indicator finds swing points that are at least some percent defined by the RetracePct input away from each other. A high swing point is where the price is higher than the previous or subsequent prices. A low swing point is where the price is lower than the previous or subsequent prices.
Default Inputs
HighPivotPrice - price value indicating the pivot high
LowPivotPrice - price value indicating the pivot low
RetracePct - minimum percentage difference between swing points to plot
LineColor - trendlines’ color
LineWidth - trendlines’ thickness
Plots
Values are not plotted. The indicator plots lines connecting high and low swing points.