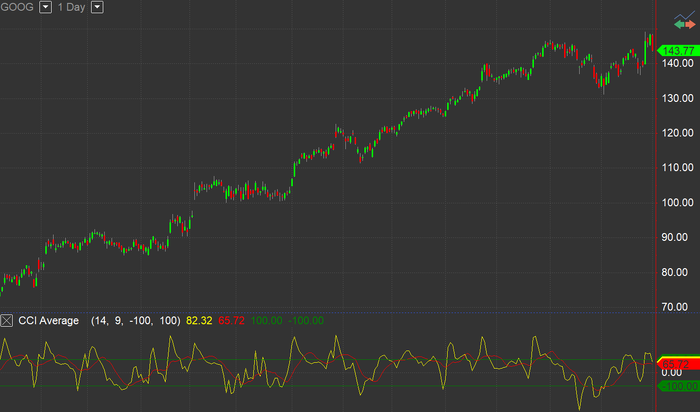
CCI Average
Commodity Channel Index Average, along with Commodity Channel Index, is commonly used for determining cycle beginning and ending in futures markets. This indicator may also help to identify buy and sell opportunities.
CCI takes a security's change in price and compares that to its average change in price. CCI's calculation produces positive and negative values that oscillate above and below a Zero Line. Typically a value of 100 is identified as overbought and a reading of -100 is identified as being oversold. However, it is important to note a couple of things. Actual overbought and oversold thresholds can vary depending on the financial instrument being traded. For example, a more volatile instrument may have thresholds at 200 and -200. Frequently, overbought/oversold conditions are seen as a precursor to a price reversal. However, when using CCI, overbought and oversold conditions can often be a sign of strength, meaning the current trend may be strengthening and continuing. When applied to a chart, this indicator contains three plots, displayed in a separate subgraph from the price data.
Default Inputs
CCILength (14) - number of bars used for CCI calculation.
CCIAvgLength (9) - number of bars used for calculation of the CCI average.
OverSold (-100) - value used to identify oversold market.
OverBought (100) - value used to identify overbought market.
Plots
Plot1 (CCI, Yellow) - CCI line.
Plot2 (CCIAvg, Red) - average of the CCI.
Plot3 (OverBot, Dark Green) - overbought level reference line.
Plot4 (OverSld, Dark Green) - oversold level reference line.
