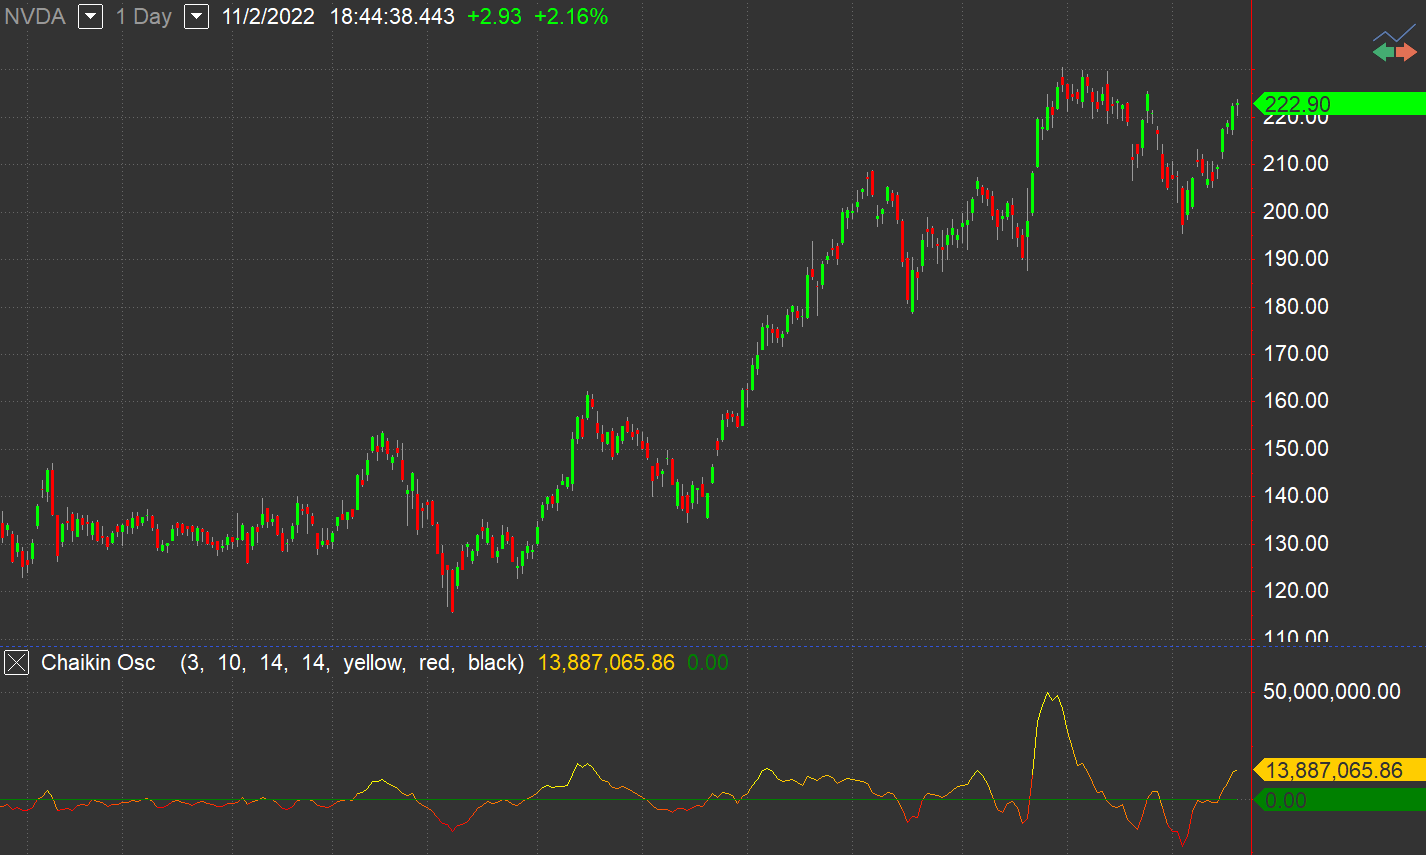
Chaikin Osc
The Chaikin Oscillator takes Accumulation/Distribution (ADL) and applies two Exponential Moving Averages of varying length to the line. The Chaikin Oscillator's value is then derived by subtracting the longer term EMA of the ADL from the shorter term EMA of the ADL. Ultimately this serves as a way to measure the momentum of the ADL by plotting a line which fluctuates between positive and negative values. Being aware of changes in momentum can help a trader or technical analyst to anticipate trend changes since changes in momentum often precede changes in trend.
Default Inputs
FastLength (3) sets the number of bars to calculate the fast exponential average.
SlowLength (10) sets the number of bars to calculate the slow exponential average.
AlertLength (14) sets the number of bars to determine the Alert criteria.
ColorNormLength (14) sets the number of bars over which to normalize the indicator for gradient coloring.
UpColor (Yellow) sets the color to use for indicator values that are relatively high over ColorNormLength bars. Set to -1 to disable gradient color plotting.
DnColor (Red) sets the color to use for indicator values that are relatively low over ColorNormLength bars. Set to -1 to disable gradient color plotting.
GridForegroundColor (Black) sets the color to use for numbers in the Scanner cells when gradient coloring is enabled, that is, when both UpColor and DnColor are set to non-negative values.