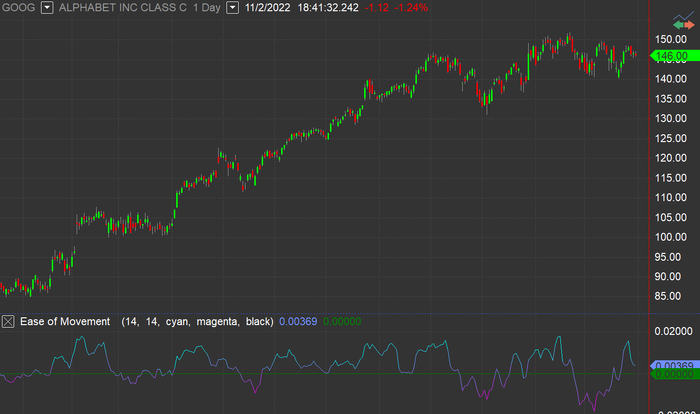
Ease of Movement
Definition
The Ease of Movement indicator is a volume based oscillator. It is designed to measure the relationship between price and volume and display that relationship as an oscillator that fluctuates between positive and negative values. The EOM fluctuates above and below a Zero Line. This is done in order to quantify the "ease" of price movements. A basic understanding is that when the EOM is in positive territory, prices are advancing with relative ease. When the EOM is negative, prices are declining with relative ease.
The Ease of Movement indicator (EOM) was developed and introduced by Richard Arms.
EOM plots a line that fluctuates between positive and negative values. Simply put, when the values are positive, price is advancing. When numbers are negative, prices are declining. One has to remember from the above calculations that price distance moved determines whether the EOM line is positive or negative. The Box Ratio, (which is determined by (volume)) is what determines the strength or range of that move. Therefore, when it comes to analyzing EOM, keep two points in mind. A wide range with low volume indicates a high level of ease of movement. A narrow range with high volume indicates a low level of ease of movement.
Because of the role that volume plays in the Ease of Movement indicator, many technical analysts use a standard Volume indicator in conjunction with the EOM.
Default Inputs
SmoothingLength sets the time period to be used in calculating the EOM, 14 by default.
ColorNomLength sets the number of bars used in the coloring algorithm, 14 by default.
UpColor sets the color for indicator values that are relatively high over ColorNormLength bars, cyan by default.
DnColor sets the color for indicator values that are relatively low over ColorNormLength bars, magenta by default.
GridForegroundColor sets the color for numbers in Scanner cells when both UpColor and DnColor are set to positive values, black by default.
