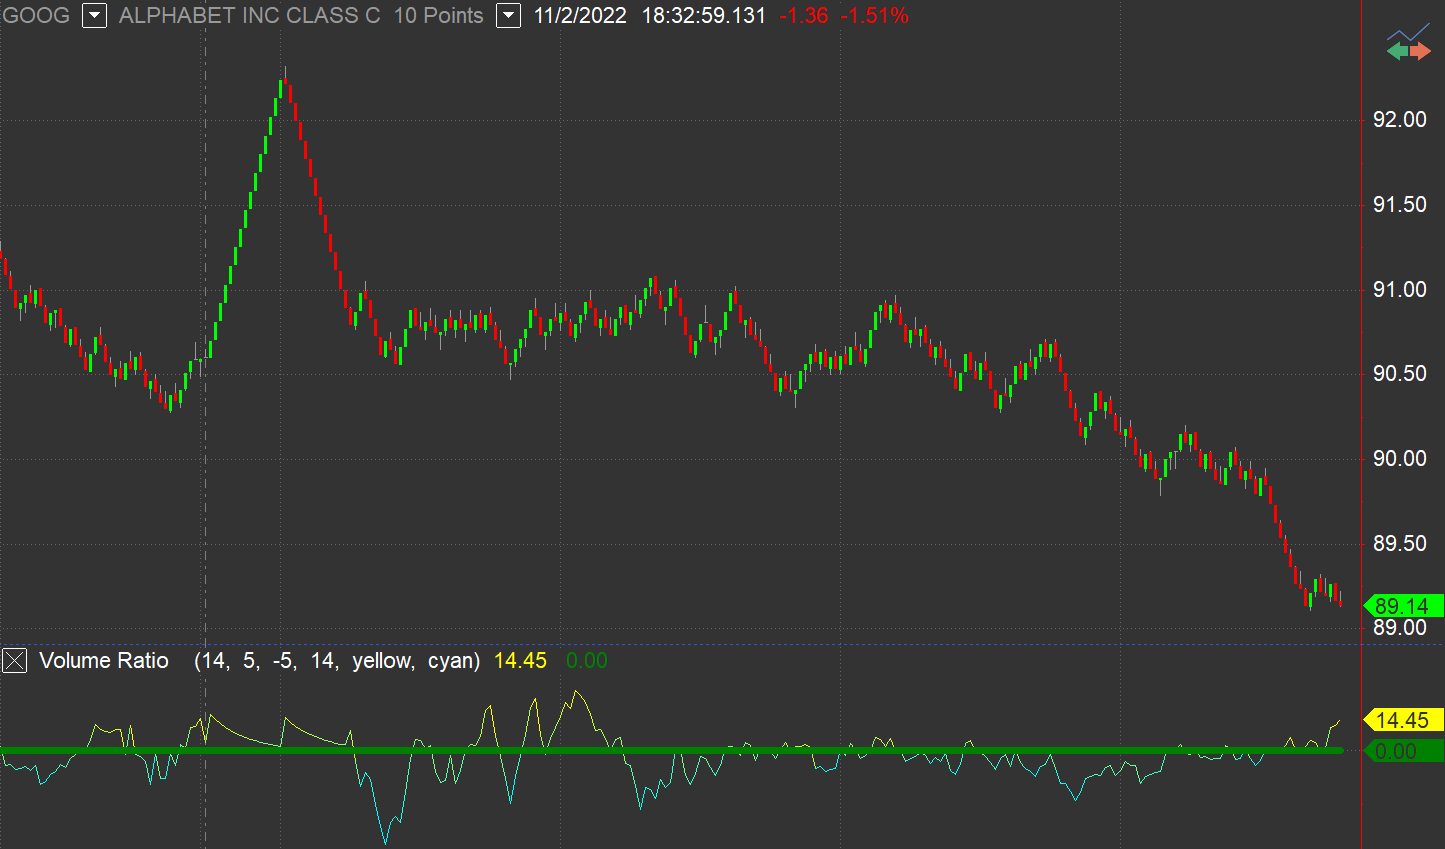
Volume Ratio
This indicator determines an exponential moving average of the ratio between up and down volume. Then it plots the exponential average as an oscillator around a zero line.
The Volume Ratio can help to reveal the strength or weakness of a price trend. Positive values are plotted above the zero line, and negative below. A positive value suggests there is enough market support to continue to drive price activity in the direction of the current trend. A negative value suggests there is a lack of support and prices may begin to become stagnant or reverse.
Default Inputs
AvgLength (14) sets the number of bars used to calculate the volume ratio.
UpVolAlertPct (5) sets the value to trigger the alert for "Up" ticks.
DnVolAlertPct (-5) sets the value to trigger the alert for "Down" ticks.
ColorNormLength (14) sets the number of bars over which to normalize the indicator for gradient coloring.
UpColor (Yellow) sets the color to use for indicator values that are relatively high over ColorNormLength bars. Set to -1 to disable gradient color plotting.
DnColor (Cyan) sets the color to use for indicator values that are relatively low over ColorNormLength bars. Set to -1 to disable gradient color plotting.