Walk Forward Optimization
Walk Forward Optimization is an optimization process that addresses the issue of curve fitting in strategy development.
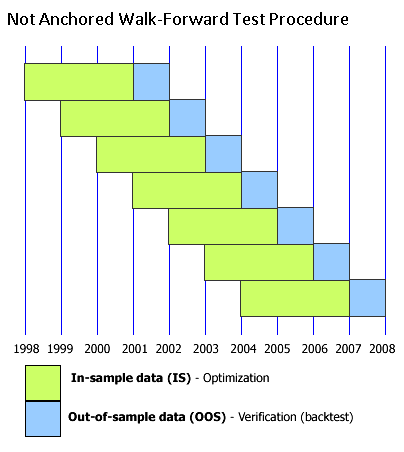
Walk Forward Optimization segregates the data series into multiple segments, and each segment is divided into an in-sample (IS) portion and an out-of-sample (OOS) portion.
Parameter optimization for the strategy is performed using the IS portion of the first segment. The same parameters are then used to back test the strategy on the OOS portion of the same segment. The process is repeated for the remaining segments.
The OOS performance results from each of the segments are considered "real" instead of "curve-fit" because the parameters that produced the OOS results were generated from IS data.
Walk Forward Optimization (not anchored)
Suppose a data series has 220 bars, and it is divided into five segments of 100 bars per segment.
The first 70 bars of each segment are the IS portion and the remaining 30 bars are the OOS portion.
The table below shows the segmentation details.
| Segment | # of Bars per Segment | ||
|---|---|---|---|
| IS | OOS | ||
| Segment 1 | 1-70 | 71-100 | 100 |
| Segment 2 | 31-100 | 101-130 | 100 |
| Segment 3 | 61-130 | 131-160 | 100 |
| Segment 4 | 91-160 | 161-190 | 100 |
| Segment 5 | 121-190 | 191-220 | 100 |
Step 1: Parameter optimization is performed using Segment 1's IS data. These parameters are then used to back test the strategy on Segment 1's OOS data.
Step 2: Parameter optimization is performed using Segment 2's IS data. These parameters are then used to back test the strategy on Segment 2's OOS data.
Step 3: Parameter optimization is performed using Segment 3's IS data. These parameters are then used to back test the strategy on Segment 3's OOS data.
Step 4: Parameter optimization is performed using Segment 4's IS data. These parameters are then used to back test the strategy on Segment 4's OOS data.
Step 5: Parameter optimization is performed using Segment 5's IS data. These parameters are then used to back test the strategy on Segment 5's OOS data.
The walk forward optimization is complete.
There are OOS performance results for bars 71-220. Walk Forward Optimization considers the OOS performance results "real" instead of "curve-fit" because the parameters that produced the OOS results were generated from IS data.
As shown, the starting point of each subsequent segment begins 30 bars after the starting point of the previous segment. The starting point of each segment steps forward. Hence, this type of walk forward optimization is said to be not anchored. The reason the step is 30 bars is because that's the length of the OOS portion.
Walk Forward Optimization (anchored)
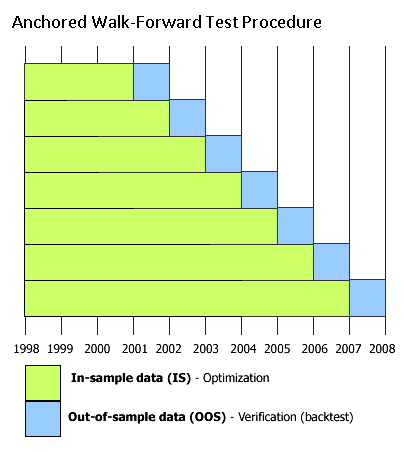
Anchoring means the starting point of all segments is the same as the starting point of the first segment.
The starting points do not step forward. Hence, this type of walk forward optimization is said to be anchored.
The effect is that the IS portion of each subsequent segment is longer than IS portion of the previous segment, and therefore the total length of each subsequent segment is also longer than the total length of the previous segment.
The table below shows the segmentation details.
| Segment | # of Bars per Segment | ||
|---|---|---|---|
| IS | OOS | ||
| Segment 1 | 1-70 | 71-100 | 100 |
| Segment 2 | 1-100 | 101-130 | 130 |
| Segment 3 | 1-130 | 131-160 | 160 |
| Segment 4 | 1-160 | 161-190 | 190 |
| Segment 5 | 1-190 | 191-220 | 220 |
The rest of the anchored walk forward optimization process is the same as not-anchored walk forward optimization.
Using Walk Forward Optimization
To use Walk Forward Optimization:
- 1. Open the Format Objects window.
To open the Format Objects window, right-click on an empty area of the chart and then click Format Signals.
The Format Objects window can also be opened by one of the following methods:
- Select Format in the main menu and click Signal.
- Double-click any one of the signal's labels on the chart.
- Position the mouse pointer over any one of the signal's labels on the chart; once the Pointer changes into a Hand
  , right-click the label and then click Format Signals.
 - 2. Select the Signals tab and select the signal in the box.
- 3. Click the Optimize button. The Optimization Settings window will appear.
- 4. Select the optimizable inputs and optimization method – exhaustive or genetic (both will work with Walk Forward Optimization.) Please refer to Performing_Optimization for more information.
- 5. Click Next, and the Set Walk-Forward Parameters section will appear.
- 6. There are two possible types of segmentation for Walk-Forward Optimization: by number of runs and by time span. Select the desired one in the Segments Type section.
- 7. If Number of Runs is selected:
Enter the number of runs into the Number of Runs: textbox.
Enter the percentage number for the OOS portion of a segment into the OOS, % of first Run: textbox.
When Number of Runs is selected, the segmentation is always performed according to bars.
- 8. If Time Span is selected:
Enter the number of bars/days for the IS portion of a segment into the IS textbox.
Enter the number for the OOS portion of a segment into the OOS textbox. The number can be expressed as a percentage, if % of the first Run is selected in the next dropdown list, or in bars/days, if same as IS is selected there.
- 9. Check the Anchored checkbox to use anchoring. Uncheck the Anchored checkbox to not use anchoring.
- 10. Click the Next button.
- 11. In the Set Robustness Settings section set up the criteria according to which the robustness of the strategy will be estimated. For more information about Strategy Robustness click on What is Robustness? link.
- 12. Click Analyze N Combinations to run Walk-Forward Analysis and generate the Walk-Forward Optimization Report.

