Hello,
I have just down loaded your free .net product which is really good.
I am having problems creating a volume delta chart and was wondering if you can give me some help?
I am streaming live data (the Last Traded Price and the volume) from excel DDE, which is working great. If I follow the advice from https://www.multicharts.com/trading-sof ... lume_Delta I can get the volume delta by selecting the 'Last Traded Price' from the instrument.
My question is, how do I add the volume to this so the volume delta shows the volume traded in the boxes? At the moment it just shows the resolution in seconds in reverse.
Do you have any video up to show how to set up the volume delta?
I hope this makes sense.
regards
herbie
Volume Delta
-
Henry MultiСharts

- Posts: 9165
- Joined: 25 Aug 2011
- Has thanked: 1264 times
- Been thanked: 2957 times
Re: Volume Delta
Hello herbie,
Please attach the following screenshots:
1) your chart window;
2) Format->Instrument->Settings tab;
3) Format->Instrument->Style tab.
Please attach the following screenshots:
1) your chart window;
2) Format->Instrument->Settings tab;
3) Format->Instrument->Style tab.
Re: Volume Delta
thanks for the prompt response .
I hope these screen shot help..
I hope these screen shot help..
- Attachments
-
- volume delta herbie.JPG
- (151.44 KiB) Downloaded 1641 times
-
Henry MultiСharts
- Posts: 9165
- Joined: 25 Aug 2011
- Has thanked: 1264 times
- Been thanked: 2957 times
Re: Volume Delta
Hello Henry,
I have now changed to up tick-down tick, but it still doesnt show me how much volume has been traded at each price in each delta box on the chart.
What I am trying to find out is the following:
For the Volume Delta to work does it need both Last Traded Price and Volume formatted on the same graph?
If so, how do I get that to happen?
I hope you understand my problem..
thanks herbie
-
Henry MultiСharts
- Posts: 9165
- Joined: 25 Aug 2011
- Has thanked: 1264 times
- Been thanked: 2957 times
Re: Volume Delta
Hello herbie,
On Format->Instrument->Settings tab please select Build Volume on:Trade Volume.
On Format->Instrument->Settings tab please select Build Volume on:Trade Volume.
Re: Volume Delta
hello again Henry,
Im still having trouble getting the volume into the volume delta chart.
I was wondering if you can help me further?
I will go through, step by step, what I am doing.
If you have the patience, could you please give me some pointers as to where Im going wrong. This has become an obsessive task and I refuses to be beaten, as Im sure it's my own stupidity that is holding me up.
Right...here we go:
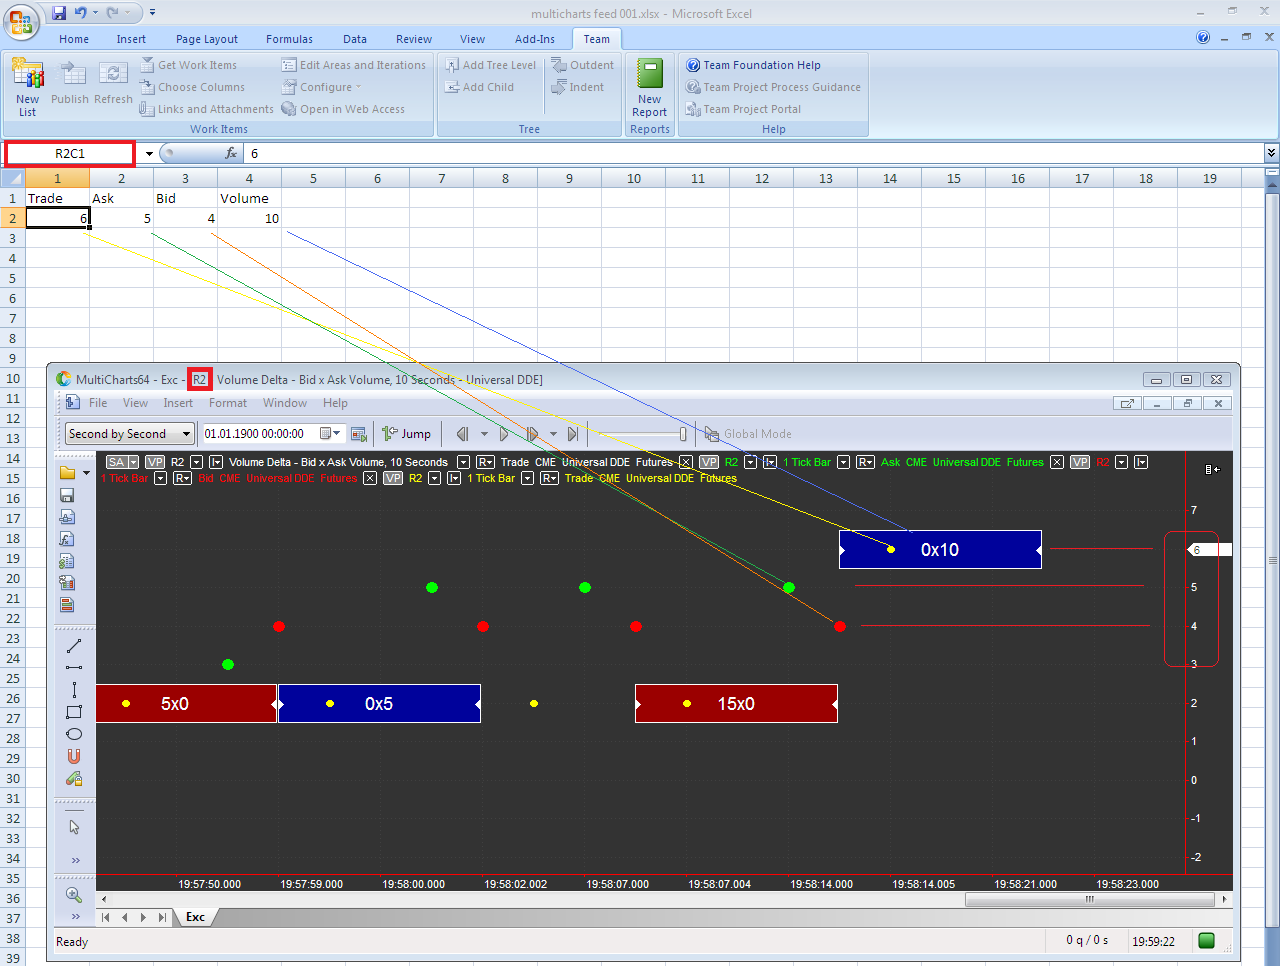
First of all I have set up a DDE connection to excel to give multicharts a live data feed of Last traded price (which I have called Price) and volume (which I have called Trade volume).
This works fine. I can create individual charts one being a price chart and the other a volume chart. So far so good.,
Next
If I open up multicharts for a new day to create a volume delta chart, first of all I set up my excel/DDE feed then fire up multicharts.
I click on the - Create new chart window
this gives me- format instrument
I change - Data Source to universalDDE
on- All Instruments -it shows the following: R51C3 Price NASDAQ
R51C4 Trade Volume NASDAQ
I click on Price and it turns blue
I now click on - Settings
choose - Volume Delta from the drop down menu on the upper left
Resolution 10 seconds
Breakdown by up tick v down tick
Show volume as bid x ask volume
Chart settings
Quote field Trade
Session Default
Build Volume on Trade Volume
Data Range
5 bars back from 14/06/2013
Dispay
time zone local
data number 1
subchart show on top
on-style I have- volume delta -highlighted
scaling highlighted is- screen
Volume Profile is unticked
I press OK and the chart appears as shown on the attachment screenshot.
On the right side of the charts I see the seconds counting down from 10 to 1. within the green and red boxes on the chart it counts up to about 147 each 10 seconds even if no volume has been traded.
Im at a loss to what I am doing wrong.
my questions
Why does it count to 147 when no volume has been traded?
Regarding- Build on - Trade Volume - Does this mean the chart reads my volume R51C4 to get the data to create the numbers in the red and green boxes?
Im sorry for being so long winded and I hope you understand what Im talking about
regards
herbie
Im still having trouble getting the volume into the volume delta chart.
I was wondering if you can help me further?
I will go through, step by step, what I am doing.
If you have the patience, could you please give me some pointers as to where Im going wrong. This has become an obsessive task and I refuses to be beaten, as Im sure it's my own stupidity that is holding me up.
Right...here we go:
First of all I have set up a DDE connection to excel to give multicharts a live data feed of Last traded price (which I have called Price) and volume (which I have called Trade volume).
This works fine. I can create individual charts one being a price chart and the other a volume chart. So far so good.,
Next
If I open up multicharts for a new day to create a volume delta chart, first of all I set up my excel/DDE feed then fire up multicharts.
I click on the - Create new chart window
this gives me- format instrument
I change - Data Source to universalDDE
on- All Instruments -it shows the following: R51C3 Price NASDAQ
R51C4 Trade Volume NASDAQ
I click on Price and it turns blue
I now click on - Settings
choose - Volume Delta from the drop down menu on the upper left
Resolution 10 seconds
Breakdown by up tick v down tick
Show volume as bid x ask volume
Chart settings
Quote field Trade
Session Default
Build Volume on Trade Volume
Data Range
5 bars back from 14/06/2013
Dispay
time zone local
data number 1
subchart show on top
on-style I have- volume delta -highlighted
scaling highlighted is- screen
Volume Profile is unticked
I press OK and the chart appears as shown on the attachment screenshot.
On the right side of the charts I see the seconds counting down from 10 to 1. within the green and red boxes on the chart it counts up to about 147 each 10 seconds even if no volume has been traded.
Im at a loss to what I am doing wrong.
my questions
Why does it count to 147 when no volume has been traded?
Regarding- Build on - Trade Volume - Does this mean the chart reads my volume R51C4 to get the data to create the numbers in the red and green boxes?
Im sorry for being so long winded and I hope you understand what Im talking about
regards
herbie
- Attachments
-
- herbie volume delta and volume multicharts 002.JPG
- (247.88 KiB) Downloaded 1625 times
-
Henry MultiСharts
- Posts: 9165
- Joined: 25 Aug 2011
- Has thanked: 1264 times
- Been thanked: 2957 times
Re: Volume Delta
Hello Herbie,
Please send me the Excel spreadsheet you are using and screenshot of your Universal DDE settings for data.
Please send me the Excel spreadsheet you are using and screenshot of your Universal DDE settings for data.
Re: Volume Delta
Hello Henry
Attached is the DDE setting for the Price (Last Traded Price) it is fed from C51 on the excel sheet. The excel sheet refreshes on average every 200ms
hope this helps
thanks
Herbie
Attached is the DDE setting for the Price (Last Traded Price) it is fed from C51 on the excel sheet. The excel sheet refreshes on average every 200ms
hope this helps
thanks
Herbie
- Attachments
-
- herbie DDE Price.JPG
- (189.33 KiB) Downloaded 1621 times
Re: Volume Delta
Hello Henry
...and here is the Trade volume settings which is fed from D51 on the excel sheet which refreshes every 200ms on average
once again
thanks for your patience
...and here is the Trade volume settings which is fed from D51 on the excel sheet which refreshes every 200ms on average
once again
thanks for your patience
- Attachments
-
- herbie DDE Trade Volume settings.JPG
- (196.23 KiB) Downloaded 1628 times
-
Henry MultiСharts
- Posts: 9165
- Joined: 25 Aug 2011
- Has thanked: 1264 times
- Been thanked: 2957 times
Re: Volume Delta
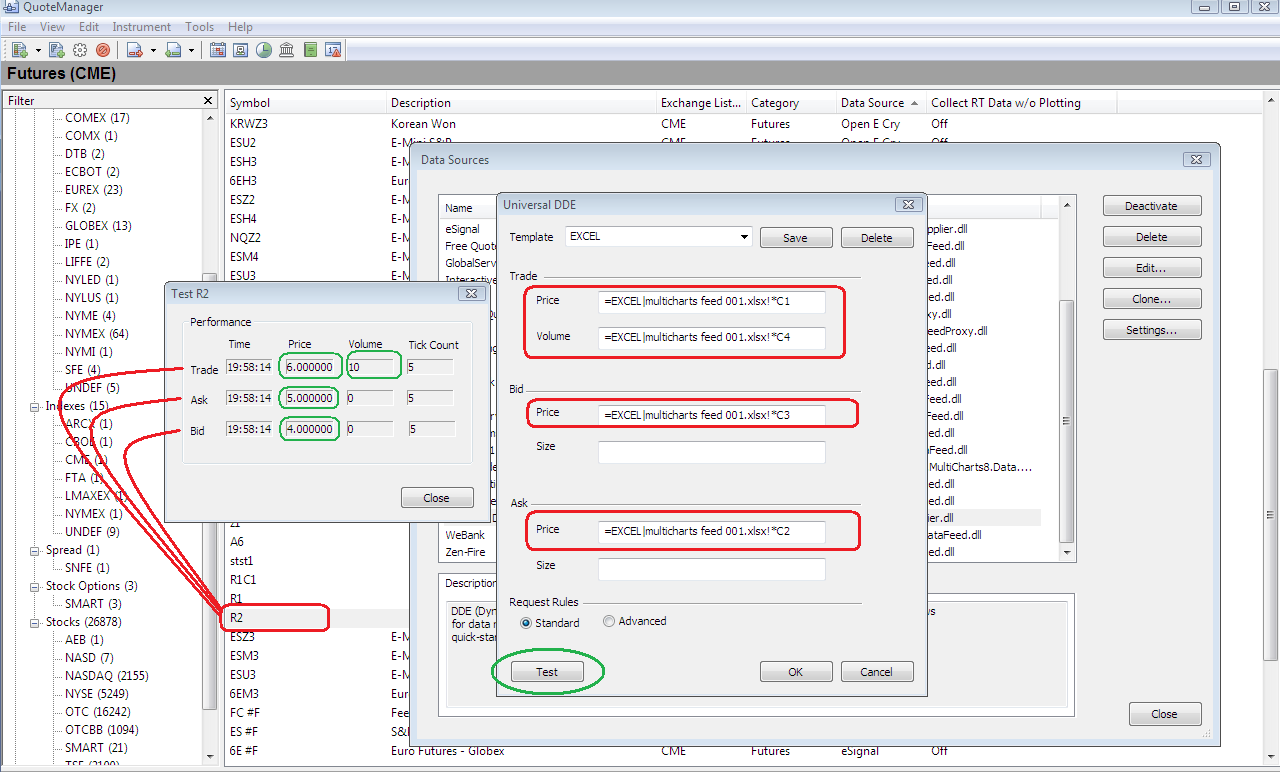
Please go to QuoteManager->Tools->Data sources->Universal DDE (the one you are using for price)->Settings->send me a screenshot of this window.
Re: Volume Delta
henry
Is this what you want?
reagrds
herbie
Is this what you want?
reagrds
herbie
- Attachments
-
- hebie Universal DDE.JPG
- (212.76 KiB) Downloaded 1604 times
-
Henry MultiСharts
- Posts: 9165
- Joined: 25 Aug 2011
- Has thanked: 1264 times
- Been thanked: 2957 times
Re: Volume Delta
Hello Herbie,
The volume should be transferred alongside with the price data for the same symbol. Please have a look at the setup we have:
The volume should be transferred alongside with the price data for the same symbol. Please have a look at the setup we have:
- Attachments
-
- 18911_1.png
- (150.22 KiB) Downloaded 1908 times
-
- 18911_2.png
- (136.08 KiB) Downloaded 1902 times
Re: Volume Delta
Hello Henry,
At long last I have managed to set up getting my live feed from excel through multicharts.net and it's working fine. Thanks for all your patience and help.
The only problem I am having now is controlling the box sizes on the volume delta. I set my scale up and the delta boxes are always to tall.
I have found a volume delta chart from another part of your forum which shows exactly what Im after.
download/file.php?mode=view&id=5692
Can you tell me what settings on the instrument and how to format the price scale to achieve this chart setting please? Also, can I achieve this set-up using the tick settings, 1 tick, 5 tick, 15 tick and 45 tick.
thanks
treehead
-
Henry MultiСharts
- Posts: 9165
- Joined: 25 Aug 2011
- Has thanked: 1264 times
- Been thanked: 2957 times
Re: Volume Delta
Hello Herbie,
Each volume delta box is plotted with the symbol price step (price scale * min movement).
Please refer to our Wiki section to learn how to set it up:Setting Properties
Each volume delta box is plotted with the symbol price step (price scale * min movement).
Please refer to our Wiki section to learn how to set it up:Setting Properties