TPO
- JoshM
- Posts: 2195
- Joined: 20 May 2011
- Location: The Netherlands
- Has thanked: 1544 times
- Been thanked: 1565 times
- Contact:
Re: TPO
If you are interested in the implementation details, then:can you explain a little bit what you did to make this?
1) For the analysis of the volume used by the loading of ticks DataLoader
2) To draw - IChartCustomDraw
3) Toolbar - ChartToolbar
About 2 days total.How long did it take to create?
- arnie
- Posts: 1594
- Joined: 11 Feb 2009
- Location: Portugal
- Has thanked: 481 times
- Been thanked: 514 times
Re: TPO
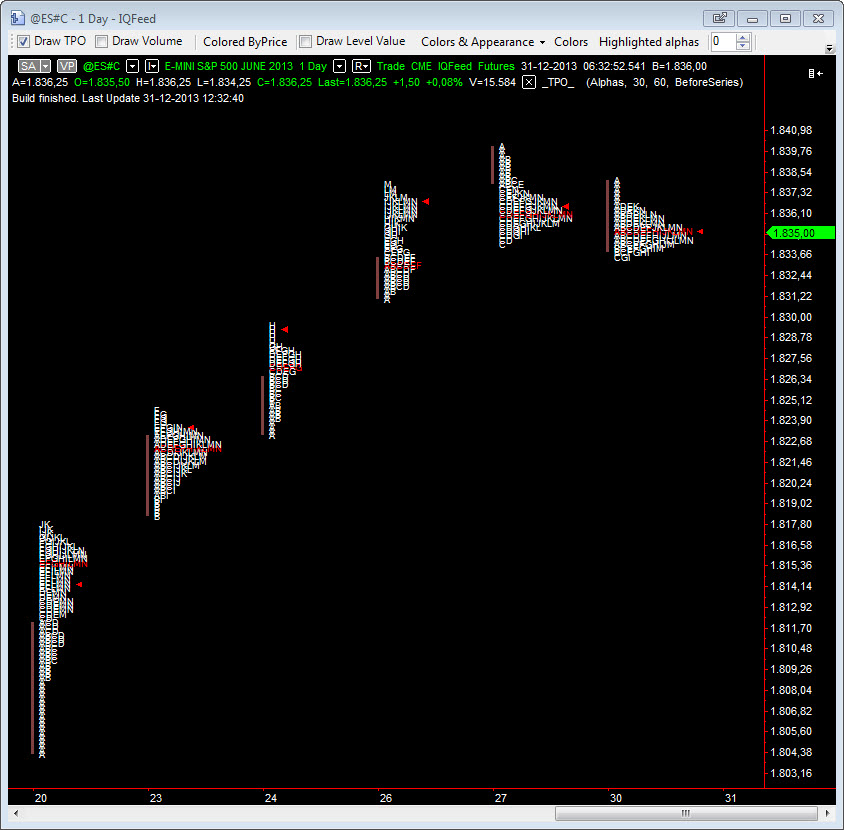
Holy crap!!!Hi all. My task is to make so-called TPO (Time Price Opportunity) indicator for new MC .NET platform. I will share the result with you. Your comments and suggestions are welcome.
P.S. For instrument use 'Exchange' timezone. For 'Local' it doesn't work.
HOW COOL IS THIS!!!
Hi Dru. Really nice job.
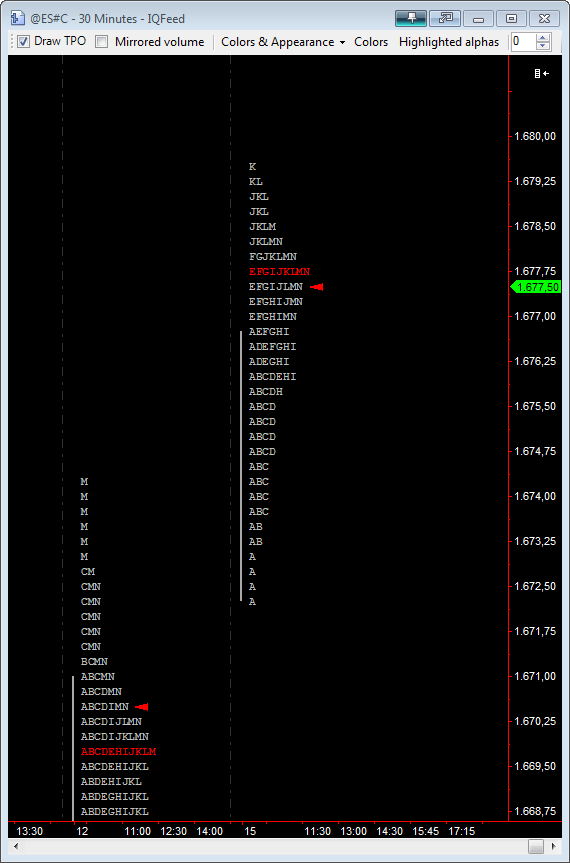
First, try to move the volume to the front of the TPO, not the back. In the back we tend to look at it as belonging to the previous period.
Second, I cannot understand your 30 minute reading. It's reading every 30 minute bracket?
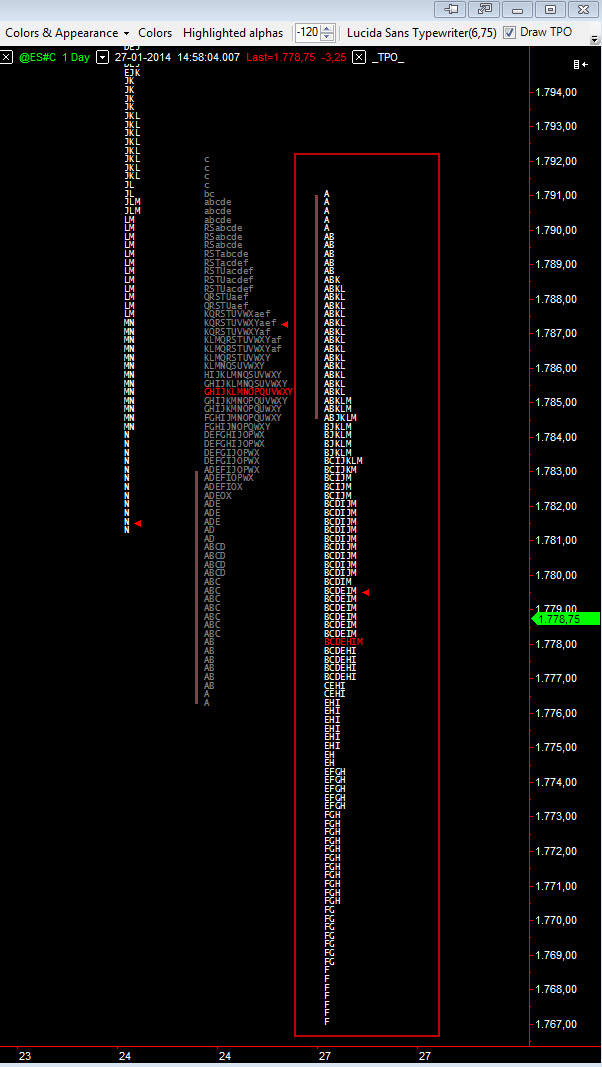
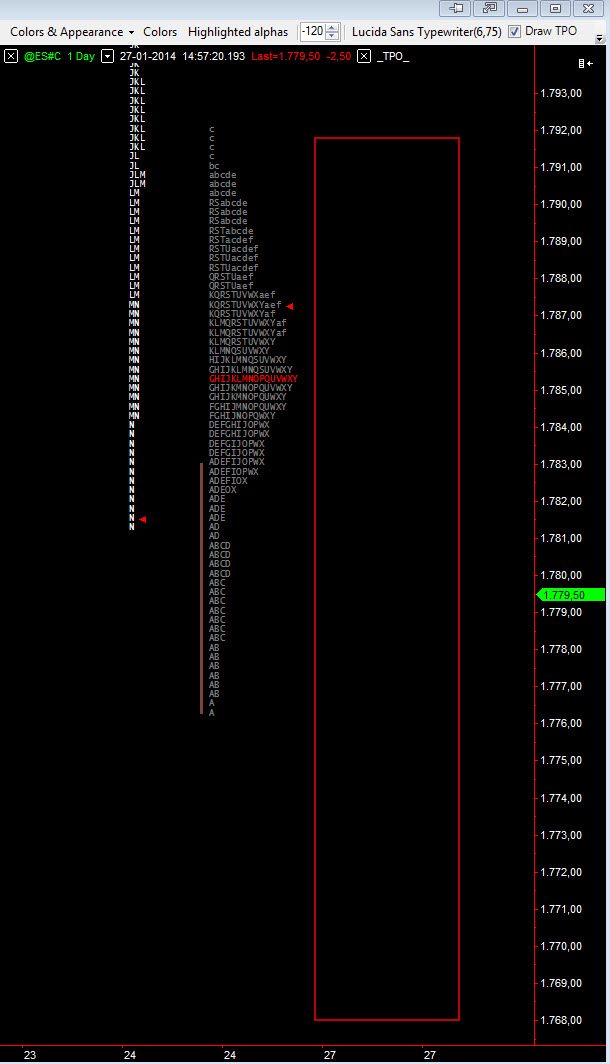
So for today, using ES 5 minute chart 24h I'm getting this:
What is this measuring exactly?
Comparing with SC's...
I see that your left TPO is identical to yesterdays profile and the right one identical to today's. So I ask, why is yesterday profile inside today's trading region? Each profile needs to be locked inside its own region otherwise create to much confusion to the eye when you have the session breaks visible.
Also, everytime you zoom out the chart the profiles get on top of each other.
TPO's need to resize themselves automatically when the chart is zooming out.
I really congratulate you for your job. Keep developing it.
I'm waiting for MC Support themselves create such charts for the regular version since, as I already explained, I'll be not upgrading to the .NET version.
Regards,
Fernando
- Attachments
-
- 04.png
- (111.72 KiB) Downloaded 17754 times
-
- 03.png
- (30.84 KiB) Downloaded 17594 times
-
- 02.png
- (57 KiB) Downloaded 17721 times
-
- 01.png
- (16.02 KiB) Downloaded 17797 times
- arnie
- Posts: 1594
- Joined: 11 Feb 2009
- Location: Portugal
- Has thanked: 481 times
- Been thanked: 514 times
Re: TPO
OK, I see that for the RTH session the TPO is in fact plotting inside its region. So maybe the 24h chart is messing the reading. Actually it looks like the code is separating the 24h data into RTH and ETH which is a very cool thing to have but yesterday's RTH need to be plotted in yesterday's region and not today's.
Again, that volume really needs to be plotted in front of the TPO.
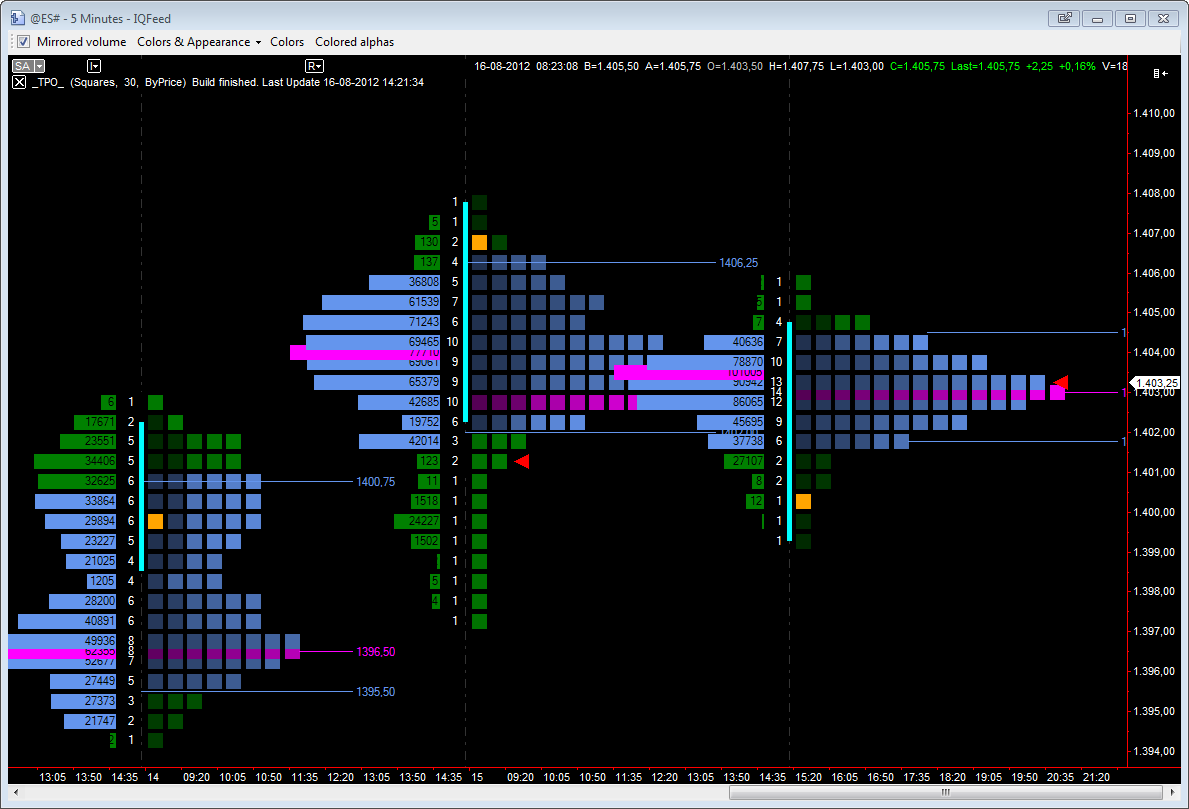
Now for the MC Support techs, guys, you really need to prepare the forum to handle big images because this complete messes up its graphic aspect.
You could implement a preview image, all having the same size and then if people wanted they could open it for the real size. As an example, look at BMT.
Again, that volume really needs to be plotted in front of the TPO.
Now for the MC Support techs, guys, you really need to prepare the forum to handle big images because this complete messes up its graphic aspect.
You could implement a preview image, all having the same size and then if people wanted they could open it for the real size. As an example, look at BMT.
- Attachments
-
- 05.png
- (59.93 KiB) Downloaded 17607 times
Re: TPO
Hello, Fernando. Thanks for advise.
 .
.
30 minutes (there are the input) - is the time interval for forming a one 'Letter' or a one 'Square'. The algorithm is same as SC's has.
 And there are no ways to increase barspacing from script yet
This is option. Try press 'Mirrored' button on the chart toolbar.First, try to move the volume to the front of the TPO, not the back. In the back we tend to look at it as belonging to the previous period.
The symbol's resolution on the chart has no effect ... almostSecond, I cannot understand your 30 minute reading. It's reading every 30 minute bracket?
30 minutes (there are the input) - is the time interval for forming a one 'Letter' or a one 'Square'. The algorithm is same as SC's has.
This is just visualization. I draw profile at last bar of session but SC draws profile at first bar of session as I can see. If SC is the standard for TPO, I have to correct the algorithm.So for today, using ES 5 minute chart 24h I'm getting this ...
I see that your left TPO is identical to yesterdays profile and the right one identical to today's. So I ask, why is yesterday profile inside today's trading region? Each profile needs to be locked inside its own region otherwise create to much confusion to the eye when you have the session breaks visible.
Agree. But MC's Chart don't know about "my pictures"Also, everytime you zoom out the chart the profiles get on top of each other.
TPO's need to resize themselves automatically when the chart is zooming out.
- arnie
- Posts: 1594
- Joined: 11 Feb 2009
- Location: Portugal
- Has thanked: 481 times
- Been thanked: 514 times
Re: TPO
Pressing Mirrored Volume makes the volume profile disappears. Mirrored it in front of the TPO, not the back.
It's not a question of SC's standard, is a question of Market and Volume Profile standard. All chart platforms uses the first bar of the session to draw the profile when plotted on the left side. If you want to draw it on the right side then you use the last session bar but you need to flip the profile. This is only done for the volume profile. I never saw no one flipping a market profile (TPO). You use the first bar so the profile stays inside its own session and not drop into next day's session.
By the way, if an option exists to remove the volume profile from the chart, what about one the remove the TPO? This way users could use only what they want. Always use the first bar of the session to plot the profile selected. If both selected they should be plotted as they are, first TPO followed by volume.
If only volume selected then you could have a second option for it to be plotted on the right side, but flipped, with the reading towards the left, not the right into next session.
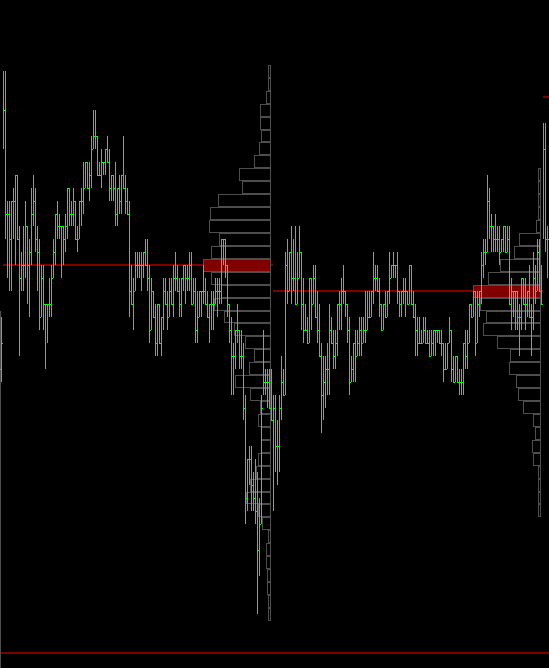
Naturally that problems related to MC itself restricts a bit the programmers work but then again, you're the man to request MC what you need
Keep the good work. Everyone appreciates it.
It's not a question of SC's standard, is a question of Market and Volume Profile standard. All chart platforms uses the first bar of the session to draw the profile when plotted on the left side. If you want to draw it on the right side then you use the last session bar but you need to flip the profile. This is only done for the volume profile. I never saw no one flipping a market profile (TPO). You use the first bar so the profile stays inside its own session and not drop into next day's session.
By the way, if an option exists to remove the volume profile from the chart, what about one the remove the TPO? This way users could use only what they want. Always use the first bar of the session to plot the profile selected. If both selected they should be plotted as they are, first TPO followed by volume.
If only volume selected then you could have a second option for it to be plotted on the right side, but flipped, with the reading towards the left, not the right into next session.
Naturally that problems related to MC itself restricts a bit the programmers work but then again, you're the man to request MC what you need
Keep the good work. Everyone appreciates it.
- Attachments
-
- 06.png
- (6.97 KiB) Downloaded 17561 times
-
ChrisMoody

- Posts: 2
- Joined: 26 Sep 2011
- Has thanked: 6 times
Re: TPO
Dru,
Outstanding work...just what I was looking for.
2 Requests:
1. It prints over my current bars. Is there any where in the code where I can make it offset to the right more?
2. Every similar Indicator I purchased from NT has "Offset" built in to the format options. That would be a great addition so it doesn't cover the current bars.
I do realize this is free and I sincerely thank you. Also I did try to put the symbol/price on top in the visual order and it won't show the price on top. But offsetting the indicator to the right would be the best.
Thanks again...Great work
Re: TPO
Hello Dru,
This indicator works well on ES, but it does not seem to work correctly on currency futures (such as 6E). Attached is the screenshot.
ES has a minimum tick size of 0.25 points, while currency futures & FOREX have a minimum pip size of 0.0001. Can you kindly advice, if there is any additional settings I have to do, for 6E (currency futures).
Thanks & Regards,
Mohi
- Attachments
-
- 6E - EURO Futures - TPO.jpg
- (413.21 KiB) Downloaded 13057 times
Re: TPO
Can you create a chart with same symbol but with tick-based resolution, for example 300 seconds? TPO is built from ticks. Probably there are ticks that do not correspond to minutes. I've checked your test-case. TPO was built properly.This indicator works well on ES, but it does not seem to work correctly on currency futures (such as 6E).
P.S. I found a bug in visualization of TPO. Fix is attached.
- Attachments
-
- TPO.pln
- (13.56 KiB) Downloaded 1113 times
- Henry MultiСharts
- Posts: 9165
- Joined: 25 Aug 2011
- Has thanked: 1264 times
- Been thanked: 2957 times
Re: TPO
MultiCharts .Net Power Language Editor->File->Import.hello,
is someone can tell me how to insert the TPO.pln in MC, please
Thanks
Thierry
- arnie
- Posts: 1594
- Joined: 11 Feb 2009
- Location: Portugal
- Has thanked: 481 times
- Been thanked: 514 times
Re: TPO
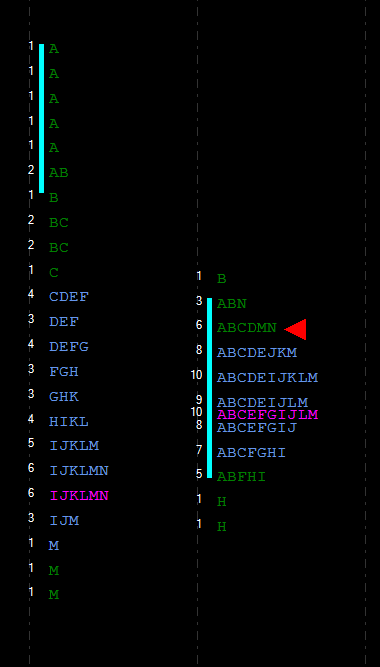
Can anyone tell me which line in the TPO code is specified the letters size?
That thing is huje and when you don't have a clue what you're looking for... but even worse, when you have no knowledge of C# language...
Can it be set to a smaller one?
When resetting the the price scale 3 lines of TPO's get hidden. If lowering the letters size can we get more visible lines?
And what about the size of the arrow that signals the close, can it be also reduced?
I assume this TPO study is the one that comes with MC, right?
Regards.
- Attachments
-
- tpo.png
- (17.81 KiB) Downloaded 16655 times
- Henry MultiСharts
- Posts: 9165
- Joined: 25 Aug 2011
- Has thanked: 1264 times
- Been thanked: 2957 times
Re: TPO
All users interested in having Market Profile as a built-in chart type can vote for this functionality here: https://www.multicharts.com/pm/viewissu ... no=MC-1307
-
rjelles

- Posts: 36
- Joined: 04 Feb 2010
- Location: Calgary, AB Canada
- Has thanked: 7 times
- Been thanked: 19 times
- Contact:
Re: TPO
Love this indicator, but just wanted to report a minor bug - often when starting MC.Net some charts with the TPO indicator attached will generate an error (see attachment), and the indicator status will be set to Off. After manually setting the status back to On, the indicator works properly - it's just at MC startup that this seems to happen.
Thanks for the great work,
Jeff
Thanks for the great work,
Jeff
- Attachments
-
- tpo_startup_error.png
- TPO startup error
- (6.44 KiB) Downloaded 12883 times
- arnie
- Posts: 1594
- Joined: 11 Feb 2009
- Location: Portugal
- Has thanked: 481 times
- Been thanked: 514 times
Re: TPO
So many people nowadays using the .NET version and not a single one able to make little enhancements on this study.
People said when the .NET version was released that finally Multicharts had a shot against NT and the thousands of free studies available for it, coded by their users but apparently all continues the same. Not a single soul was capable of making some of the enhancements requested for this study.
Very frustrating...
How will Multicharts ever grow if their users (programmers) are not of the sharing type, like most of NT users seems to be?
-
rjelles

- Posts: 36
- Joined: 04 Feb 2010
- Location: Calgary, AB Canada
- Has thanked: 7 times
- Been thanked: 19 times
- Contact:
Re: TPO
I've done some further testing on the TPO indicator, and I have a workaround that fixes the startup problem reported above, but it is just compensating for what appears to be a lower level bug in the MC.Net runtime when starting with a large number of charts to initialize. In this case, the chart does not seem to have the correct setting to report itself as a chart when the toolbar is being initialized.
The current workaround adds exception handling to the init_toolbar code (which now reports the failure is throwing a vague "Application Error exception" from the MC.Net runtime) and retries the initialization on the first call of CalcBar - this seems to work ok fine in all cases, but of course doesn't address the root problem.
I'll run some further tests later this week and then post the updated code.
Hope this helps a bit!
Jeff
- arnie
- Posts: 1594
- Joined: 11 Feb 2009
- Location: Portugal
- Has thanked: 481 times
- Been thanked: 514 times
Re: TPO
Like I already said, Dru coded a magnificent study but it needs some improvements to become really, really workable.
This Saturday, after spending a couple of hours looking at the code, I felt searching for a needle in a haystack. Remarkably, I was able to find the lines where the text size is set, among a couple of other things.
So from this:
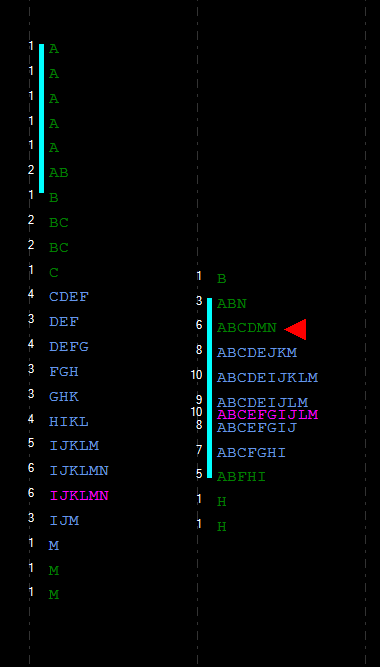
I was able to arrive to this:
Way better...
By the way, since I was not able to create a copy of the original study because it would give an error every time I tried to compile it, I worked on the original code so I have no way to compare both codes on the last day for a better visual comparison.
Now the improvements description that this study urgently needs:
- an option to set the font size
- an option to show/hide the TPO count
- an option to set the initial balance period (notice the vertical line only covers the A period, the first 30 minutes, but the initial balance on equities are 60 minutes)
- this study does not work with treasuries, for some reason it does not do well with fractions, so for those that trade treasuries cannot use this study
- this study only is able to plot over the default session, it gives an error on custom sessions, how can one plot profiles for globex period side by side with the RTH?
- the open coloring option does not work
- the triangle that shows the close/last price it's not realtime, it seems working on a minute reading
- when a new 30 minute period begins it takes at least 20 seconds till the corresponding letter starts to plot (when the A period ends and the B period starts, the B letter only starts to plot 20 seconds after the period started)
- it would also nice to have an option to show/hide VA and POC labels, sometimes they are useful other times they create a bit of "noise" on the chart.
Another issue is showed in this video:
http://www.screencast.com/t/sXYG87BbfLN
The chart on the right shows the 10 year note chart. See how it's impossible to see a complete profile in it, useless.
Another thing that makes the study a bit stressful to work with is that automatic hidding letter when we change the price scale.
I understand the idea and at some level I do agree with it, you remove identical TPO's so price scale becomes more compressed, giving us move visible data (profiles) on the chart. The problem is that this might mislead the profile reading.
I suggest an option where we would set how many ticks we want to use to build the profile, like the one we have on volume profile. This would be a more accurate reading. If not possible such option please remove that automatic hiding letter and allow the letter to be stack on top of each other. We can control this by adjusting the price scale afterwards. As it is right now, it's still possible to squeeze the price scale a little more without the letters stack on each other.
Again, since MC has this study by default on the platform it should offer the necessary support for it. If the study isn't working properly they should fix it.
Till MC management decides if they build true market profile charts on MC or not this study is capable of giving the users a very good MP experience (with the obvious restrictions, namely the splitting profiles option) but it needs to have these improvements otherwise users interested in MP charts are forced to look elsewhere.
And by the way, please do not say that you could do this as a custom programming because the price you would charge for it could pay many months of subscription using some platforms that offer full MP experience.
EDIT: I'm almost certain that the POC is not being correctly calculated.
This Saturday, after spending a couple of hours looking at the code, I felt searching for a needle in a haystack. Remarkably, I was able to find the lines where the text size is set, among a couple of other things.
So from this:
I was able to arrive to this:
Way better...
By the way, since I was not able to create a copy of the original study because it would give an error every time I tried to compile it, I worked on the original code so I have no way to compare both codes on the last day for a better visual comparison.
Now the improvements description that this study urgently needs:
- an option to set the font size
- an option to show/hide the TPO count
- an option to set the initial balance period (notice the vertical line only covers the A period, the first 30 minutes, but the initial balance on equities are 60 minutes)
- this study does not work with treasuries, for some reason it does not do well with fractions, so for those that trade treasuries cannot use this study
- this study only is able to plot over the default session, it gives an error on custom sessions, how can one plot profiles for globex period side by side with the RTH?
- the open coloring option does not work
- the triangle that shows the close/last price it's not realtime, it seems working on a minute reading
- when a new 30 minute period begins it takes at least 20 seconds till the corresponding letter starts to plot (when the A period ends and the B period starts, the B letter only starts to plot 20 seconds after the period started)
- it would also nice to have an option to show/hide VA and POC labels, sometimes they are useful other times they create a bit of "noise" on the chart.
Another issue is showed in this video:
http://www.screencast.com/t/sXYG87BbfLN
The chart on the right shows the 10 year note chart. See how it's impossible to see a complete profile in it, useless.
Another thing that makes the study a bit stressful to work with is that automatic hidding letter when we change the price scale.
I understand the idea and at some level I do agree with it, you remove identical TPO's so price scale becomes more compressed, giving us move visible data (profiles) on the chart. The problem is that this might mislead the profile reading.
I suggest an option where we would set how many ticks we want to use to build the profile, like the one we have on volume profile. This would be a more accurate reading. If not possible such option please remove that automatic hiding letter and allow the letter to be stack on top of each other. We can control this by adjusting the price scale afterwards. As it is right now, it's still possible to squeeze the price scale a little more without the letters stack on each other.
Again, since MC has this study by default on the platform it should offer the necessary support for it. If the study isn't working properly they should fix it.
Till MC management decides if they build true market profile charts on MC or not this study is capable of giving the users a very good MP experience (with the obvious restrictions, namely the splitting profiles option) but it needs to have these improvements otherwise users interested in MP charts are forced to look elsewhere.
And by the way, please do not say that you could do this as a custom programming because the price you would charge for it could pay many months of subscription using some platforms that offer full MP experience.
EDIT: I'm almost certain that the POC is not being correctly calculated.
Re: TPO
The new version of the "TPO" indicator is attached. Implemented features:
1) smaller font
2) stop that automatic resizing, hoping that resolved also the issue when using on charts quoted in fractions.
3) change the size of the triangle
4) the option to remove the TPO count on the left
5) the possibility to plot over custom time templates and not only the default one
6) fractional scales supported ("... this study does not work with treasuries ...")
- Attachments
-
- TPO.pln
- (12.79 KiB) Downloaded 1008 times
- arnie
- Posts: 1594
- Joined: 11 Feb 2009
- Location: Portugal
- Has thanked: 481 times
- Been thanked: 514 times
Re: TPO
WOW!
Beautiful job once again Dru.
Allow me to make some comments.
First what seems to be a bug.
Everytime we change the chart resolution the study toolbar disappears.
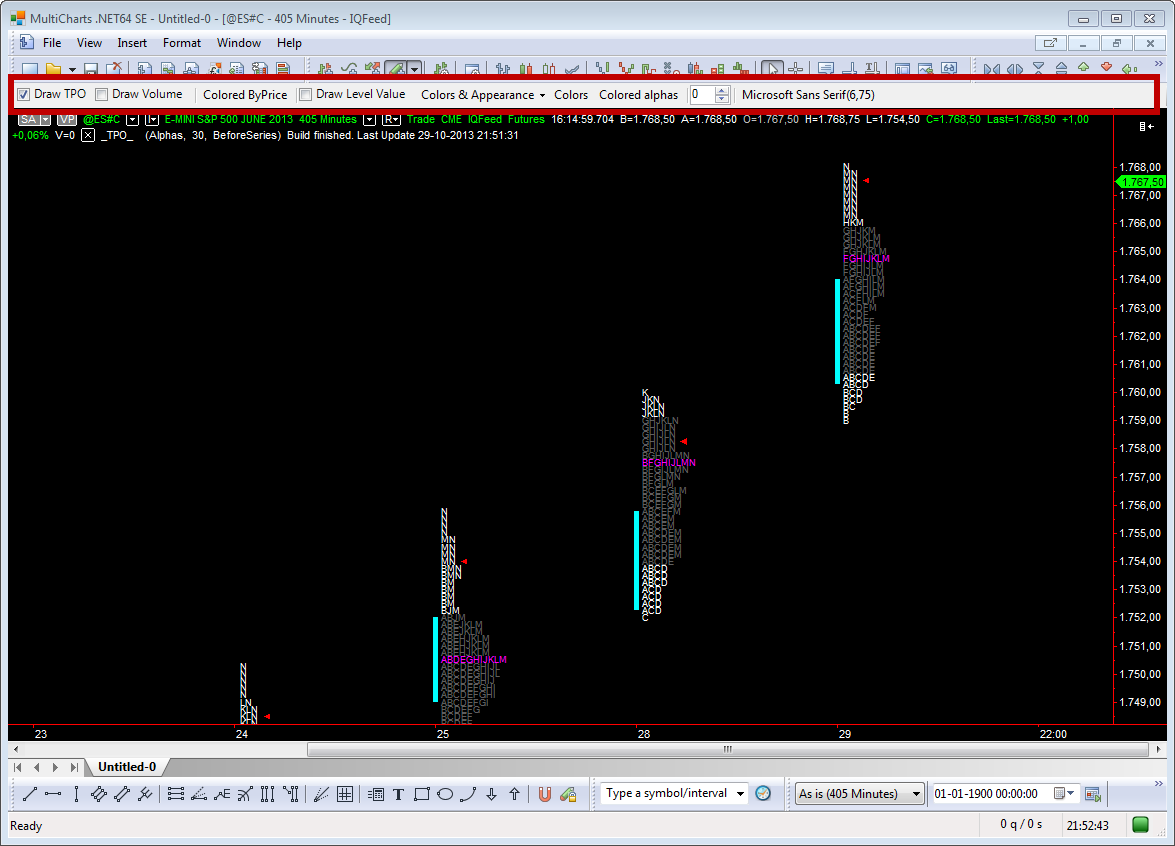
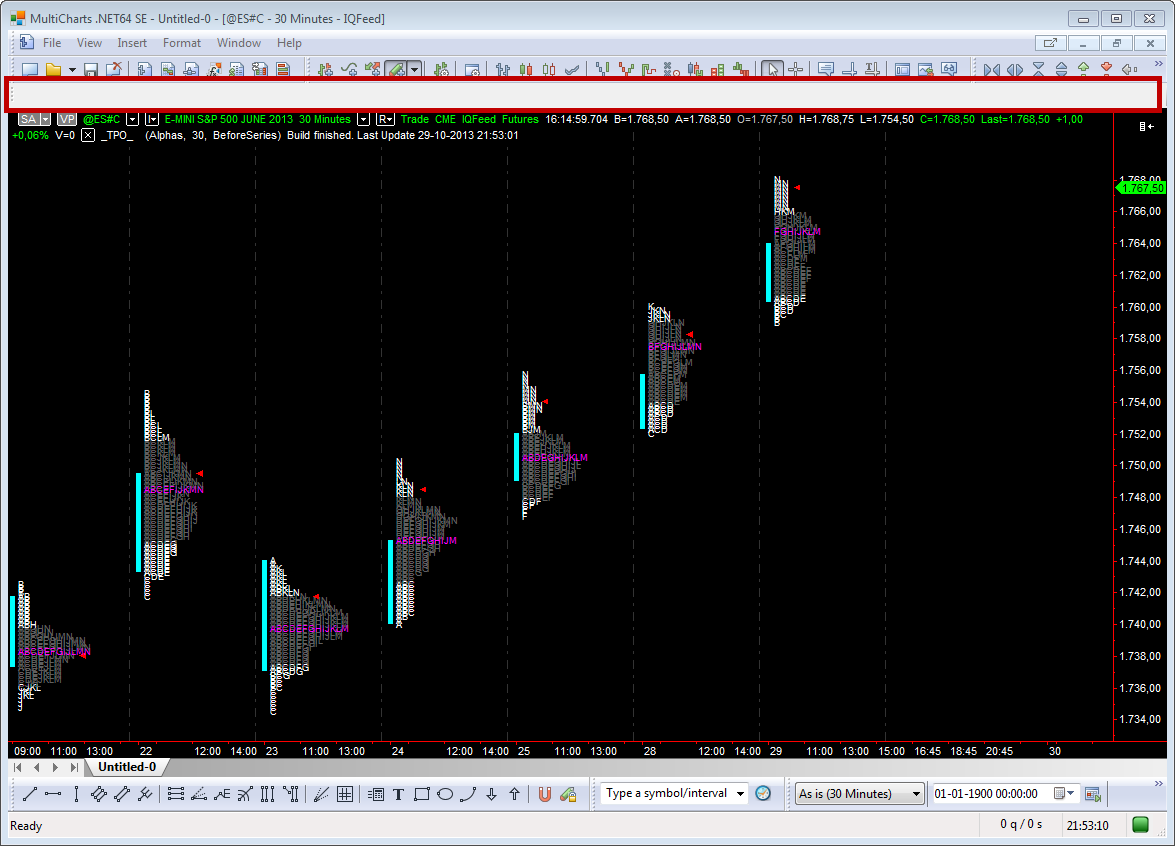
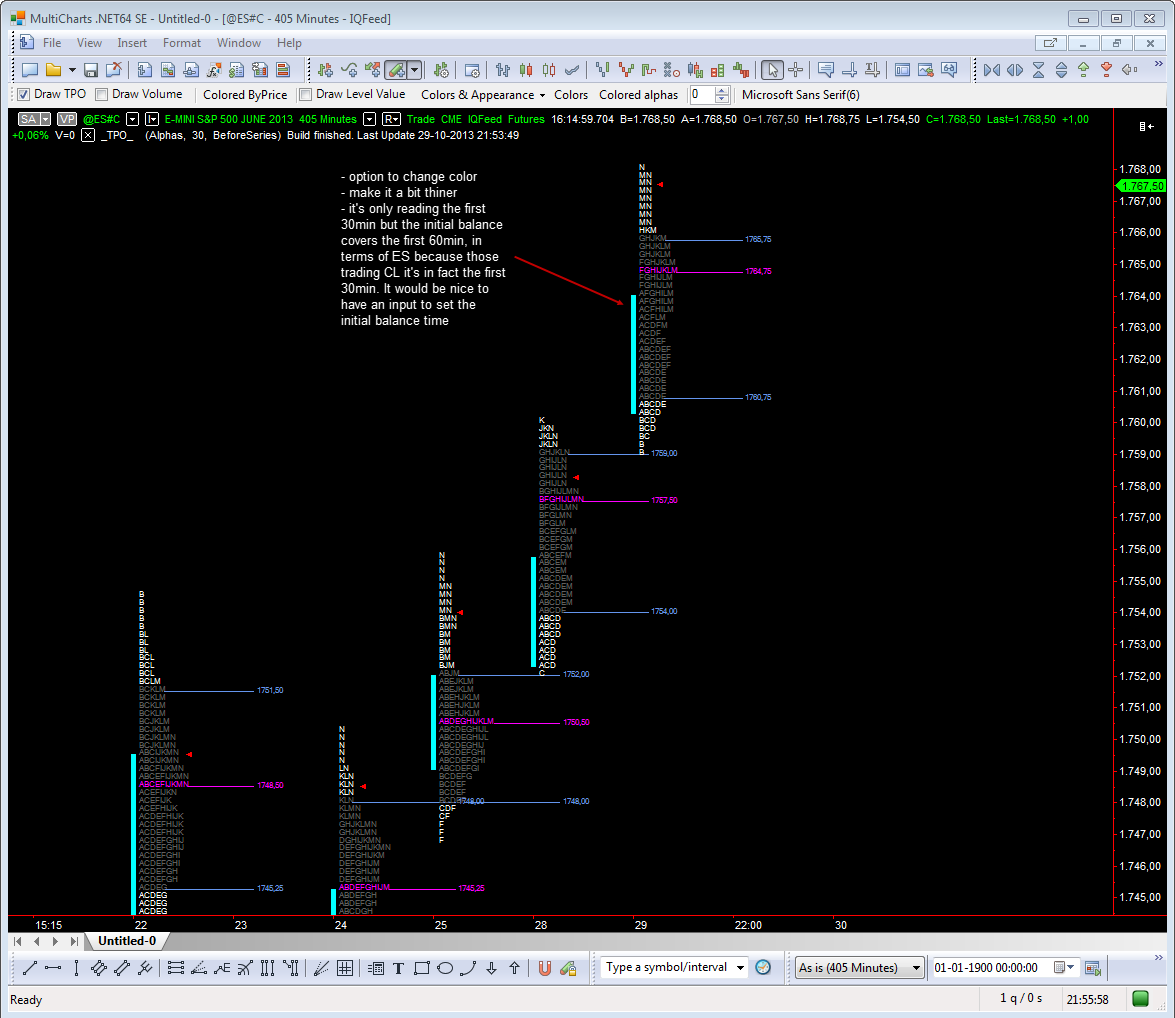
Regarding the initial balance vertical line
Treasuries are now plotting fine although the 30min bracket is not being correctly reset. For that to happen, it would need to merge the initial 10min bracket to the following 30min bracket. This way the A period would run from 7:20 till 8:00 and than the B period would start normally, at 8:00 till 8:30 and so forth...
This is a very specific option, only for symbols with odd time start, outside the 30min mark.
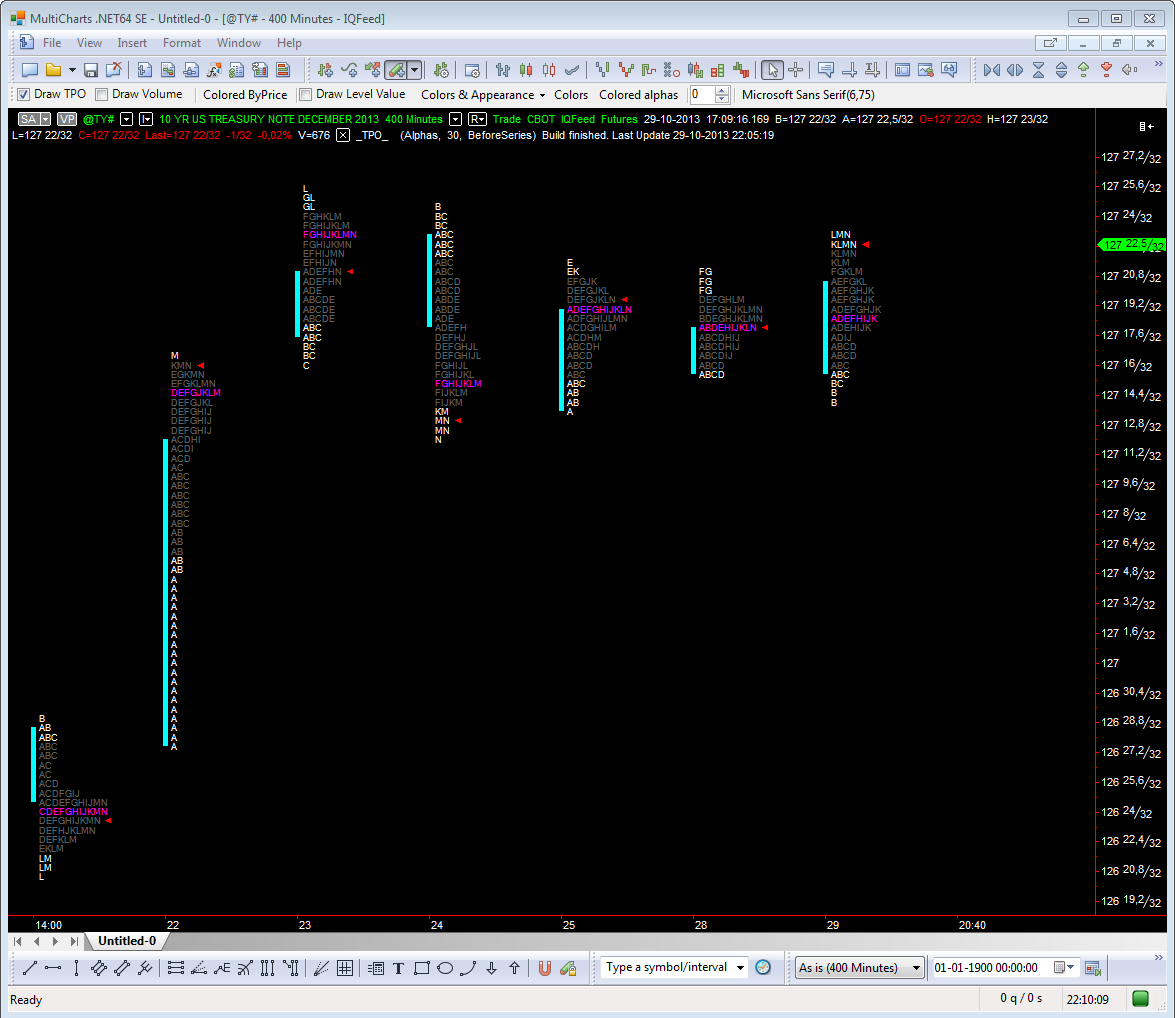
Hey Dru, you know what you should do to compliment this TPO profile study? A splitted TPO study like the one ABC coded for the regular MC version.
http://www.abctradinggroup.com/portfoli ... unstacked/
It would be nice to have this splinted study on a window side by side with the TPO profile.
The splited study would need to show the open for the day, the obvious close/last price traded and it would be nice also to have the midpoint (halfback), a line indicating the 50% of the range for the day.
Here is an example.
The horizontal lines are indicating the POC and the VA.
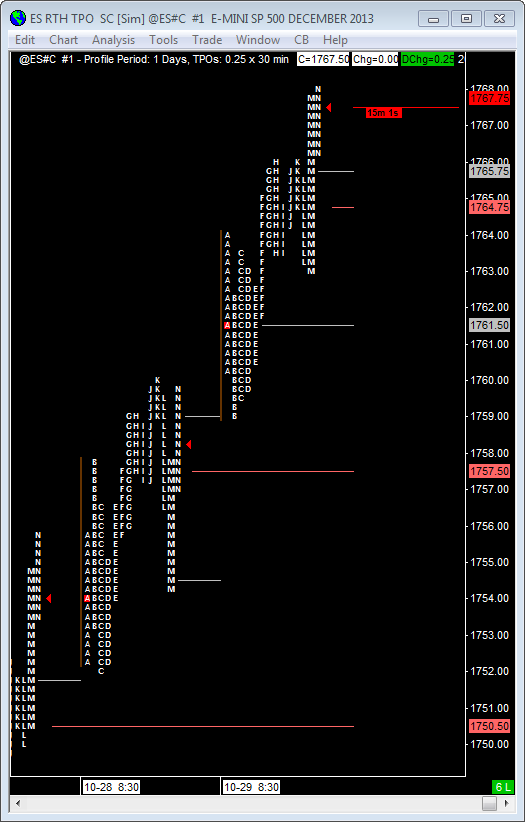
Beautiful job once again Dru.
Allow me to make some comments.
First what seems to be a bug.
Everytime we change the chart resolution the study toolbar disappears.
Regarding the initial balance vertical line
Treasuries are now plotting fine
This is a very specific option, only for symbols with odd time start, outside the 30min mark.
Hey Dru, you know what you should do to compliment this TPO profile study? A splitted TPO study like the one ABC coded for the regular MC version.
http://www.abctradinggroup.com/portfoli ... unstacked/
It would be nice to have this splinted study on a window side by side with the TPO profile.
The splited study would need to show the open for the day, the obvious close/last price traded and it would be nice also to have the midpoint (halfback), a line indicating the 50% of the range for the day.
Here is an example.
The horizontal lines are indicating the POC and the VA.
- Attachments
-
- splitted_TPO.png
- (34.58 KiB) Downloaded 15833 times
-
- MC_TPO_04.png
- (111.46 KiB) Downloaded 15824 times
-
- MC_TPO_01.png
- (131.77 KiB) Downloaded 15689 times
-
- MC_TPO_03.png
- (96.24 KiB) Downloaded 15860 times
-
- MC_TPO_02.png
- (110.84 KiB) Downloaded 15790 times
- arnie
- Posts: 1594
- Joined: 11 Feb 2009
- Location: Portugal
- Has thanked: 481 times
- Been thanked: 514 times
Re: TPO
POC is not being correctly calculated, at least for the first 30min period of the day.
See the difference between SC and MC.
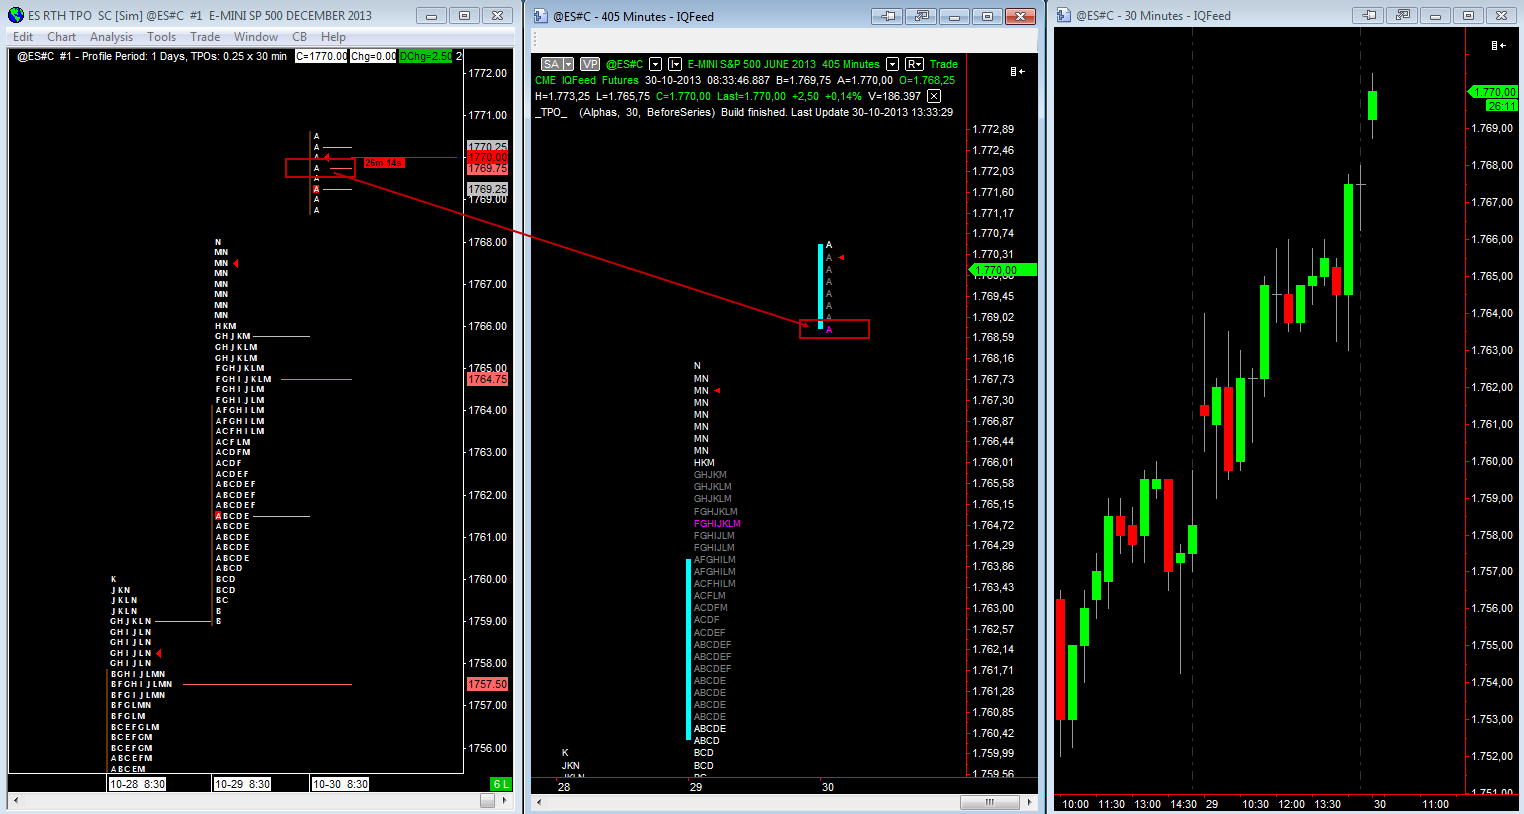
Here is a video showing the study working live.
Why does it not update realtime? Is it coded this way or is there a bug in there?
http://www.screencast.com/t/RniwPSUftvNo
See the difference between SC and MC.
Here is a video showing the study working live.
Why does it not update realtime? Is it coded this way or is there a bug in there?
http://www.screencast.com/t/RniwPSUftvNo
- Attachments
-
- POC_discrepancy.png
- (104.32 KiB) Downloaded 15759 times
- arnie
- Posts: 1594
- Joined: 11 Feb 2009
- Location: Portugal
- Has thanked: 481 times
- Been thanked: 514 times
Re: TPO
We are at the 4th period and we can clearly see how the POC is still diverging and we can also see value area diverging, at least the value area low.
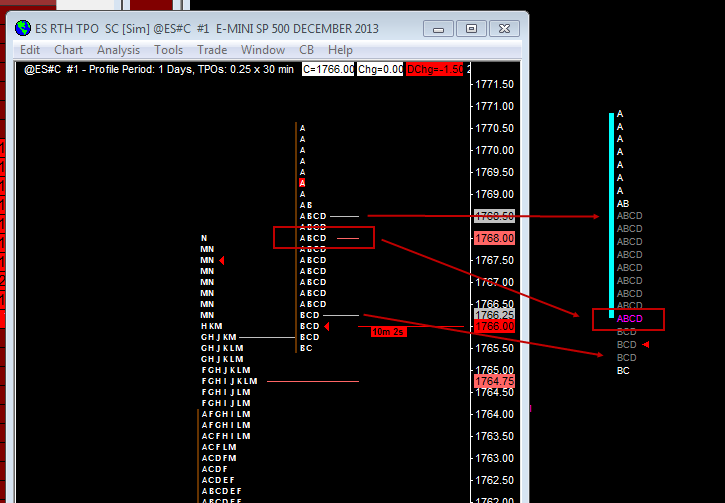
- Attachments
-
- POC_discrepancy02.png
- (37.74 KiB) Downloaded 15824 times
Re: TPO
Fixed.First what seems to be a bug.
Everytime we change the chart resolution the study toolbar disappears.
Done.Regarding the initial balance vertical line
It has been fixed and now works according to this algorithm.POC is not being correctly calculated, at least for the first 30min period of the day.See the difference between SC and MC.
It is coded this way. I was too lazyHere is a video showing the study working live.
Why does it not update realtime? Is it coded this way or is there a bug in there?
http://www.screencast.com/t/RniwPSUftvNo
- Attachments
-
- TPO.pln
- (13.11 KiB) Downloaded 798 times
- arnie
- Posts: 1594
- Joined: 11 Feb 2009
- Location: Portugal
- Has thanked: 481 times
- Been thanked: 514 times
Re: TPO
Have you fixed it?It is coded this way. I was too lazyHere is a video showing the study working live.
Why does it not update realtime? Is it coded this way or is there a bug in there?
http://www.screencast.com/t/RniwPSUftvNo
For what I've seen there's still a lag.
See how F period on the left chart made a new high but MC TPO on the right chart is still one tick below.
Also, I didn't noticed if it's the same issue or not but why doesn't the triangle updates in tandem with the price marker on the price scale? There's always a lag. Price move one tick up, one tick down 10 times but the triangle does not, it stays on the same price.
I actually see something similar on the standard MC version.
We code a trendline to show the last price and that thing is incapable of updating in tandem with the price marker on the price scale.
There's always a 1 or 2 second lag. Very annoying.
Maybe it's a MC issue and not a coding issue.
Again, beautiful work Dru.
Now users have a basic market profile study capable of giving an accurate profile reading although it would be nice to have also the split version.
Believe it or not, a split TPO chart and a 30 minute candle chart are not the same thing. The TPO is capable of showing price patterns a lot easier.
Maybe MC management can hire you to code a complete market profile tool with all its main options
EDIT: a new 30 minute period began, there's at least a 10 second delay there.
- Attachments
-
- TPO_lag.png
- (17.94 KiB) Downloaded 15743 times
- arnie
- Posts: 1594
- Joined: 11 Feb 2009
- Location: Portugal
- Has thanked: 481 times
- Been thanked: 514 times
Re: TPO
Hi Dru.
Can you make a small change, making the study to start each period at even 30 min time blocks?
This way we would have a more trustful reading for treasuries.
By doing this the A period would be set between 7:20 and 7:30 and than B period would start at 7:30 even.
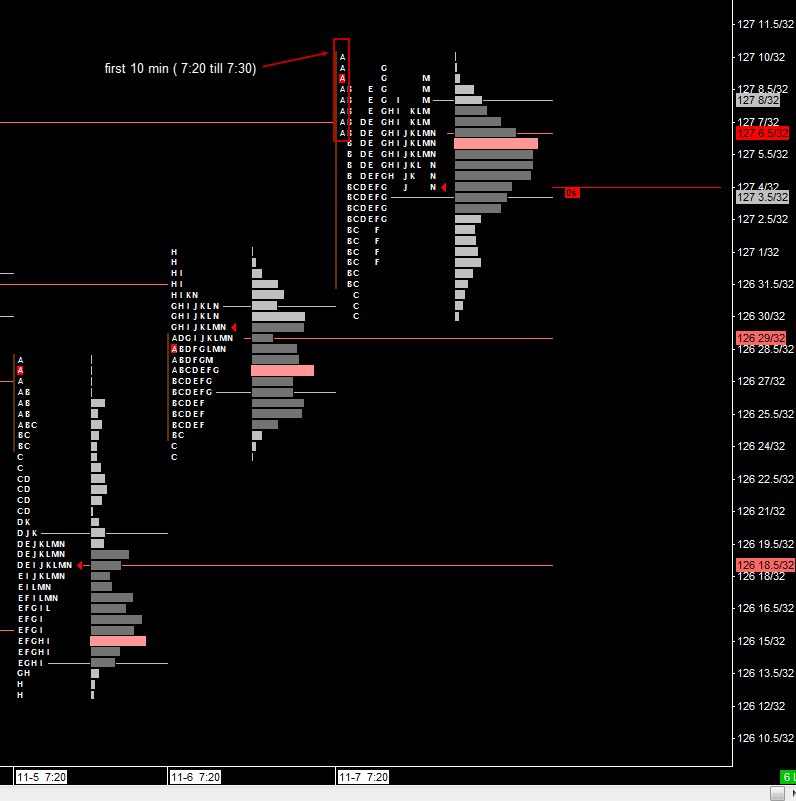
As it is right now, the A period starts at 7:20 and ends at 7:50 which ends up producing different profiles (ie. different information)
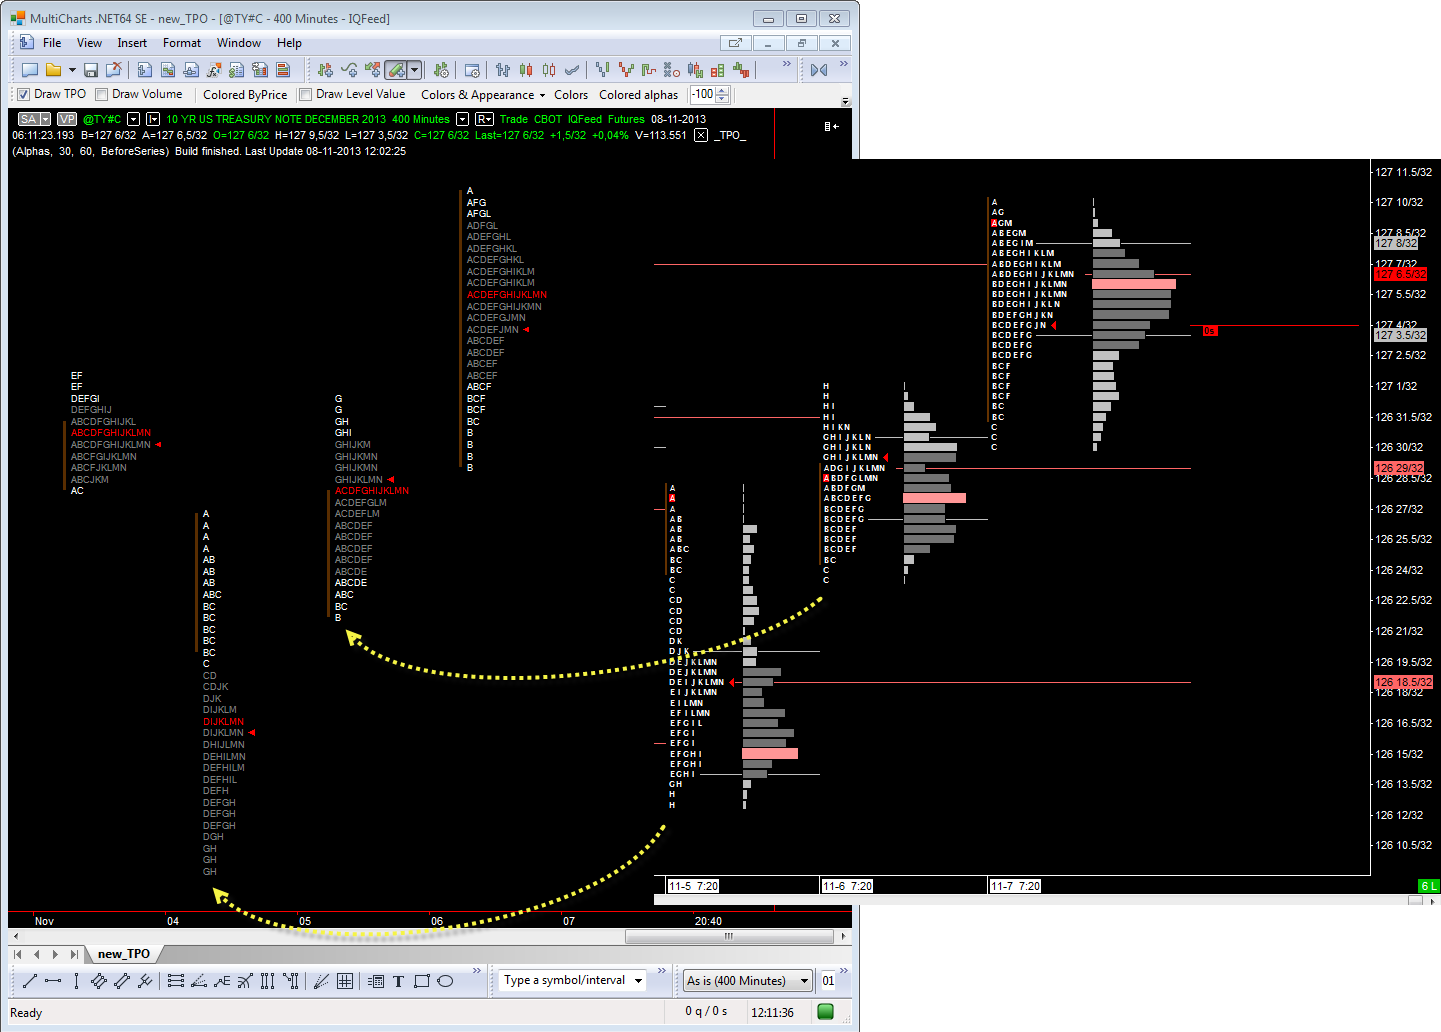
Personally I prefer another solution but I leave that for the "built in" version
Can you make a small change, making the study to start each period at even 30 min time blocks?
This way we would have a more trustful reading for treasuries.
By doing this the A period would be set between 7:20 and 7:30 and than B period would start at 7:30 even.
As it is right now, the A period starts at 7:20 and ends at 7:50 which ends up producing different profiles (ie. different information)
Personally I prefer another solution but I leave that for the "built in" version
- Attachments
-
- TY_tpo01.png
- (136.46 KiB) Downloaded 15705 times
-
- TY_tpo02.png
- (37.15 KiB) Downloaded 15769 times
-
shanemcdonald

- Posts: 196
- Joined: 08 Aug 2012
- Has thanked: 41 times
- Been thanked: 41 times
Re: TPO
Is this how it should look ?
i cant read letters or numbers
thanks
shane
i cant read letters or numbers
thanks
shane
- Attachments
-
- MultiCharts1.png
- (164.95 KiB) Downloaded 12727 times
- arnie
- Posts: 1594
- Joined: 11 Feb 2009
- Location: Portugal
- Has thanked: 481 times
- Been thanked: 514 times
Re: TPO
Manually ?
How do you change those manually ?
I like how yours look !
shane
See this video
http://www.screencast.com/t/jKWeE7Ido7
Click on gthe price scale and move it up and down with and without the Ctrl key pressed.
Re: TPO
NoHave you fixed it?
No. This is not MC issue.Maybe it's a MC issue and not a coding issue.
Realtime updates have not been implemented. Last profile is updating every 30 seconds (it requests new ticks and rebuild).
Maybe MC management can hire you to code a complete market profile tool with all its main options
Test it please.Can you make a small change, making the study to start each period at even 30 min time blocks?
- Attachments
-
- TPO.pln
- (13.14 KiB) Downloaded 829 times
- arnie
- Posts: 1594
- Joined: 11 Feb 2009
- Location: Portugal
- Has thanked: 481 times
- Been thanked: 514 times
Re: TPO
Many thanks for your replies Dru.
It seems you've nail it.
Many thanks.
There's already 22 votes for the market profile PM request so let's hope the guys at management take the votes into consideration and decide to built this into MC.
It seems you've nail it.
Many thanks.
There's already 22 votes for the market profile PM request so let's hope the guys at management take the votes into consideration and decide to built this into MC.
- arnie
- Posts: 1594
- Joined: 11 Feb 2009
- Location: Portugal
- Has thanked: 481 times
- Been thanked: 514 times
Re: TPO
if you can, make a video showing what are you doing.yes I did see it, but it did not affect my chart the same way.
yours looks great by the way !
you can use Jing for free to make a video of your screen
http://www.techsmith.com/jing.html
- arnie
- Posts: 1594
- Joined: 11 Feb 2009
- Location: Portugal
- Has thanked: 481 times
- Been thanked: 514 times
Re: TPO
Hey Dru, can you check what's happening here?
Why don't I have profiles for those 2 bars?
I download and reload the data and nothing, still no profiles.
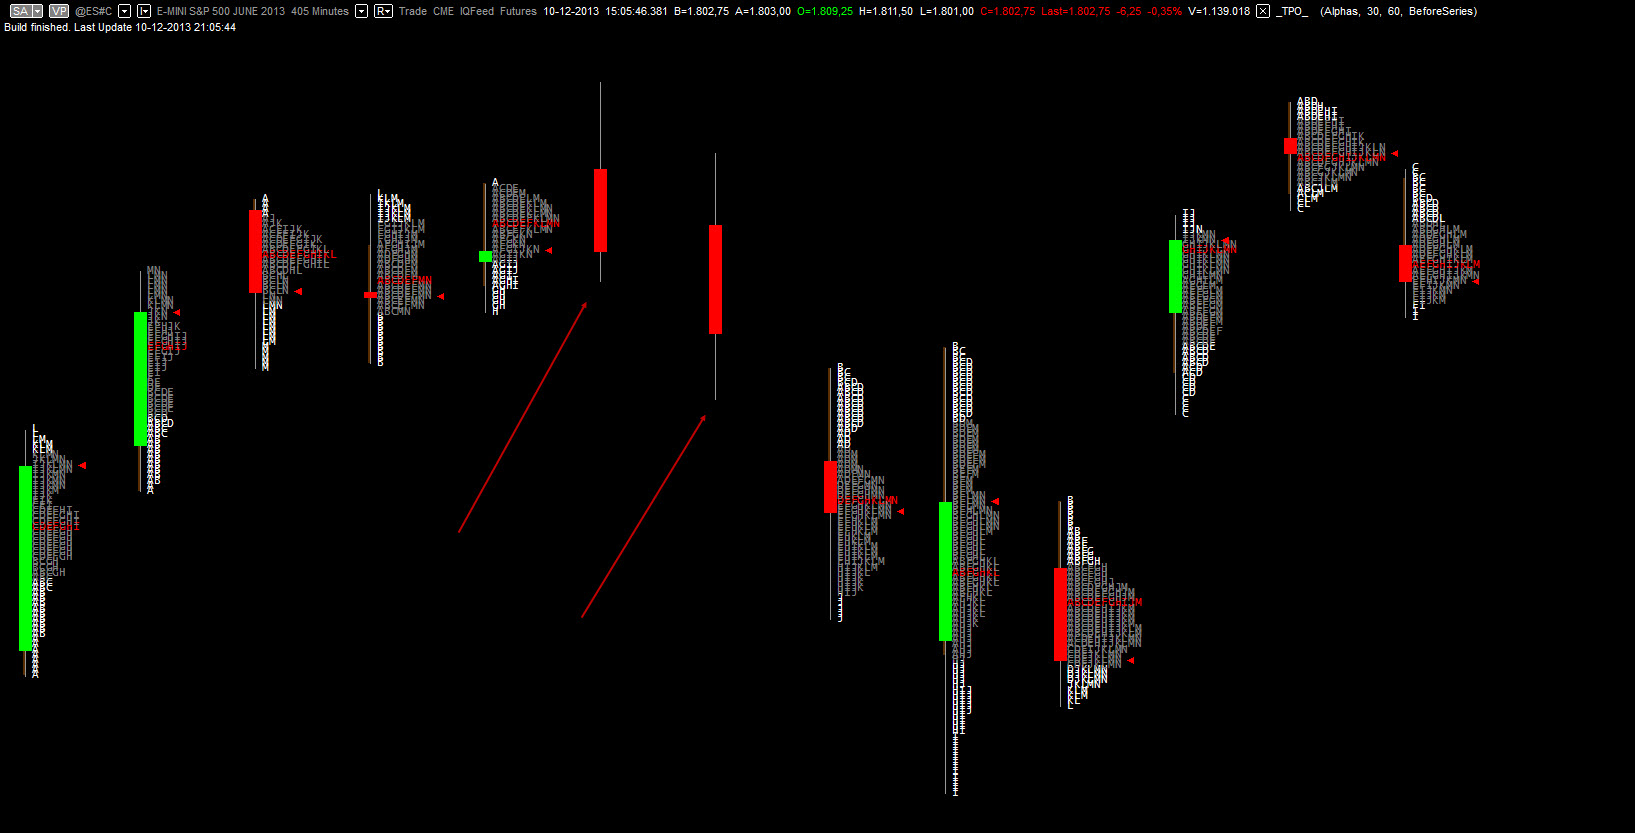
Why don't I have profiles for those 2 bars?
I download and reload the data and nothing, still no profiles.
- Attachments
-
- TPO_missing.jpg
- (200.56 KiB) Downloaded 15581 times
- arnie
- Posts: 1594
- Joined: 11 Feb 2009
- Location: Portugal
- Has thanked: 481 times
- Been thanked: 514 times
Re: TPO
I'm going nuts here...
I'm using a session template for globex only, 1700 till 830 CT.
I've reloaded minute data, I've reloaded tick data, I've created new charts, I've created new workspaces, I've deleted all data and reload new one and nothing works.
Why in God's name I can't have profiles for the last 4 days?
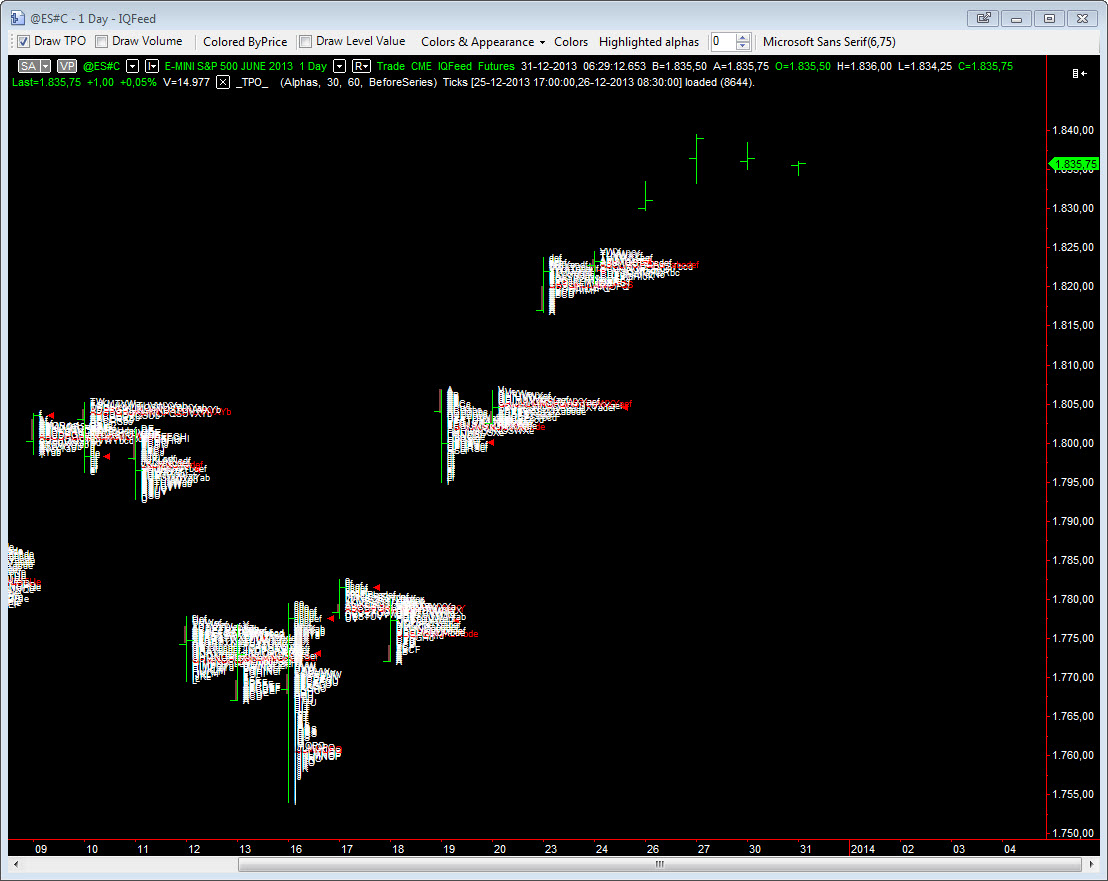
When using the RTH session template there's no profile missing
I'm using a session template for globex only, 1700 till 830 CT.
I've reloaded minute data, I've reloaded tick data, I've created new charts, I've created new workspaces, I've deleted all data and reload new one and nothing works.
Why in God's name I can't have profiles for the last 4 days?
When using the RTH session template there's no profile missing
- Attachments
-
- es02_12-31.jpg
- (174.02 KiB) Downloaded 15553 times
-
- es01_12-31.jpg
- (216.18 KiB) Downloaded 15548 times
- arnie
- Posts: 1594
- Joined: 11 Feb 2009
- Location: Portugal
- Has thanked: 481 times
- Been thanked: 514 times
Re: TPO
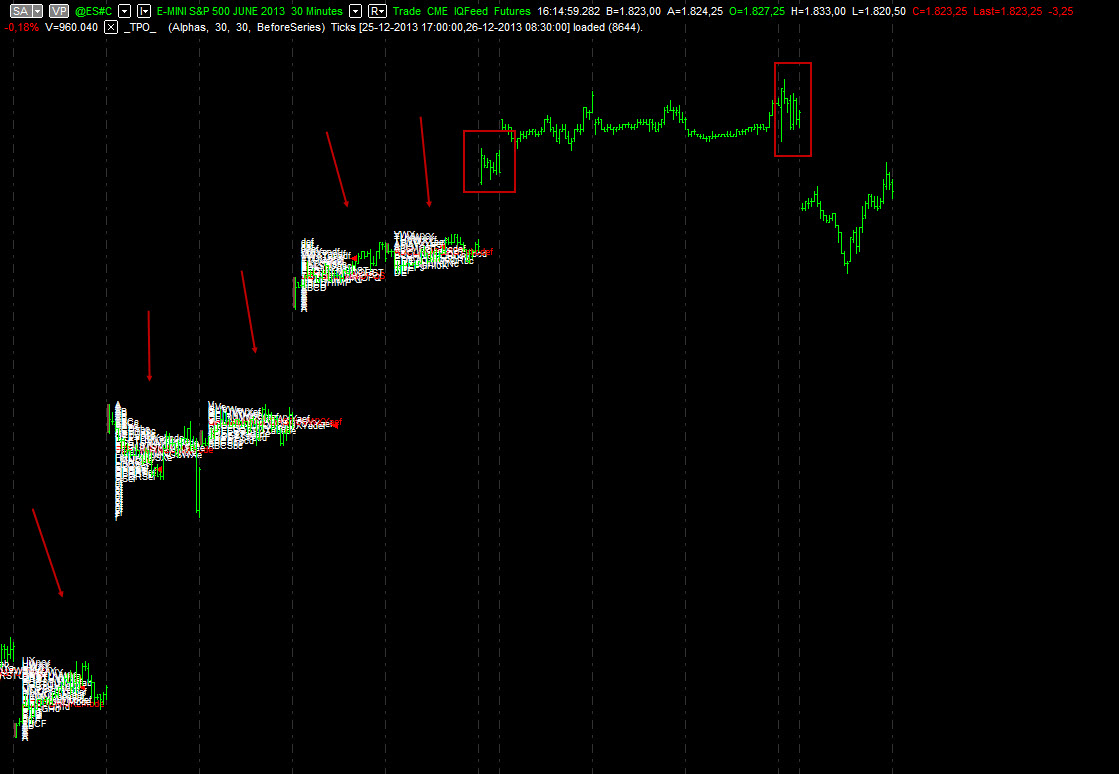
Finaly I found what the problem is regarding the overnight profiles.
Is seems the code get confused by overnight sessions not starting at 5pm CT when the session template starts the session.
On Dec 26 and Jan 02 overnight session began at 5am CT.
Notice how we have all profiles prior Dec 26 but after there's none.
By loading the data after Dec 26 you can see now that we have the profiles that were missing on the chart above.
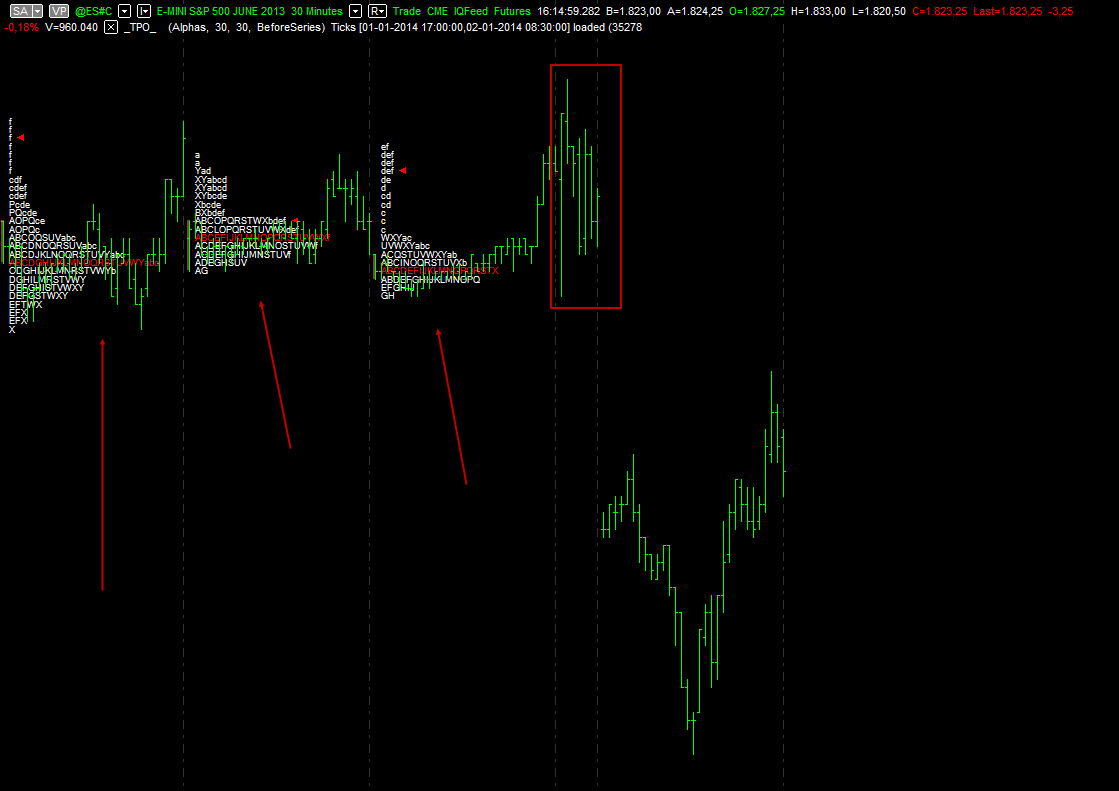
Then on Jan 02 we had another shortened overnight session and once again, the profiles get stopped again.
It would be nice if you could fix this.
Is seems the code get confused by overnight sessions not starting at 5pm CT when the session template starts the session.
On Dec 26 and Jan 02 overnight session began at 5am CT.
Notice how we have all profiles prior Dec 26 but after there's none.
By loading the data after Dec 26 you can see now that we have the profiles that were missing on the chart above.
Then on Jan 02 we had another shortened overnight session and once again, the profiles get stopped again.
It would be nice if you could fix this.
- Attachments
-
- tpo02.jpg
- (139.11 KiB) Downloaded 15392 times
-
- tpo_01.jpg
- (135.2 KiB) Downloaded 15485 times
- arnie
- Posts: 1594
- Joined: 11 Feb 2009
- Location: Portugal
- Has thanked: 481 times
- Been thanked: 514 times
Re: TPO
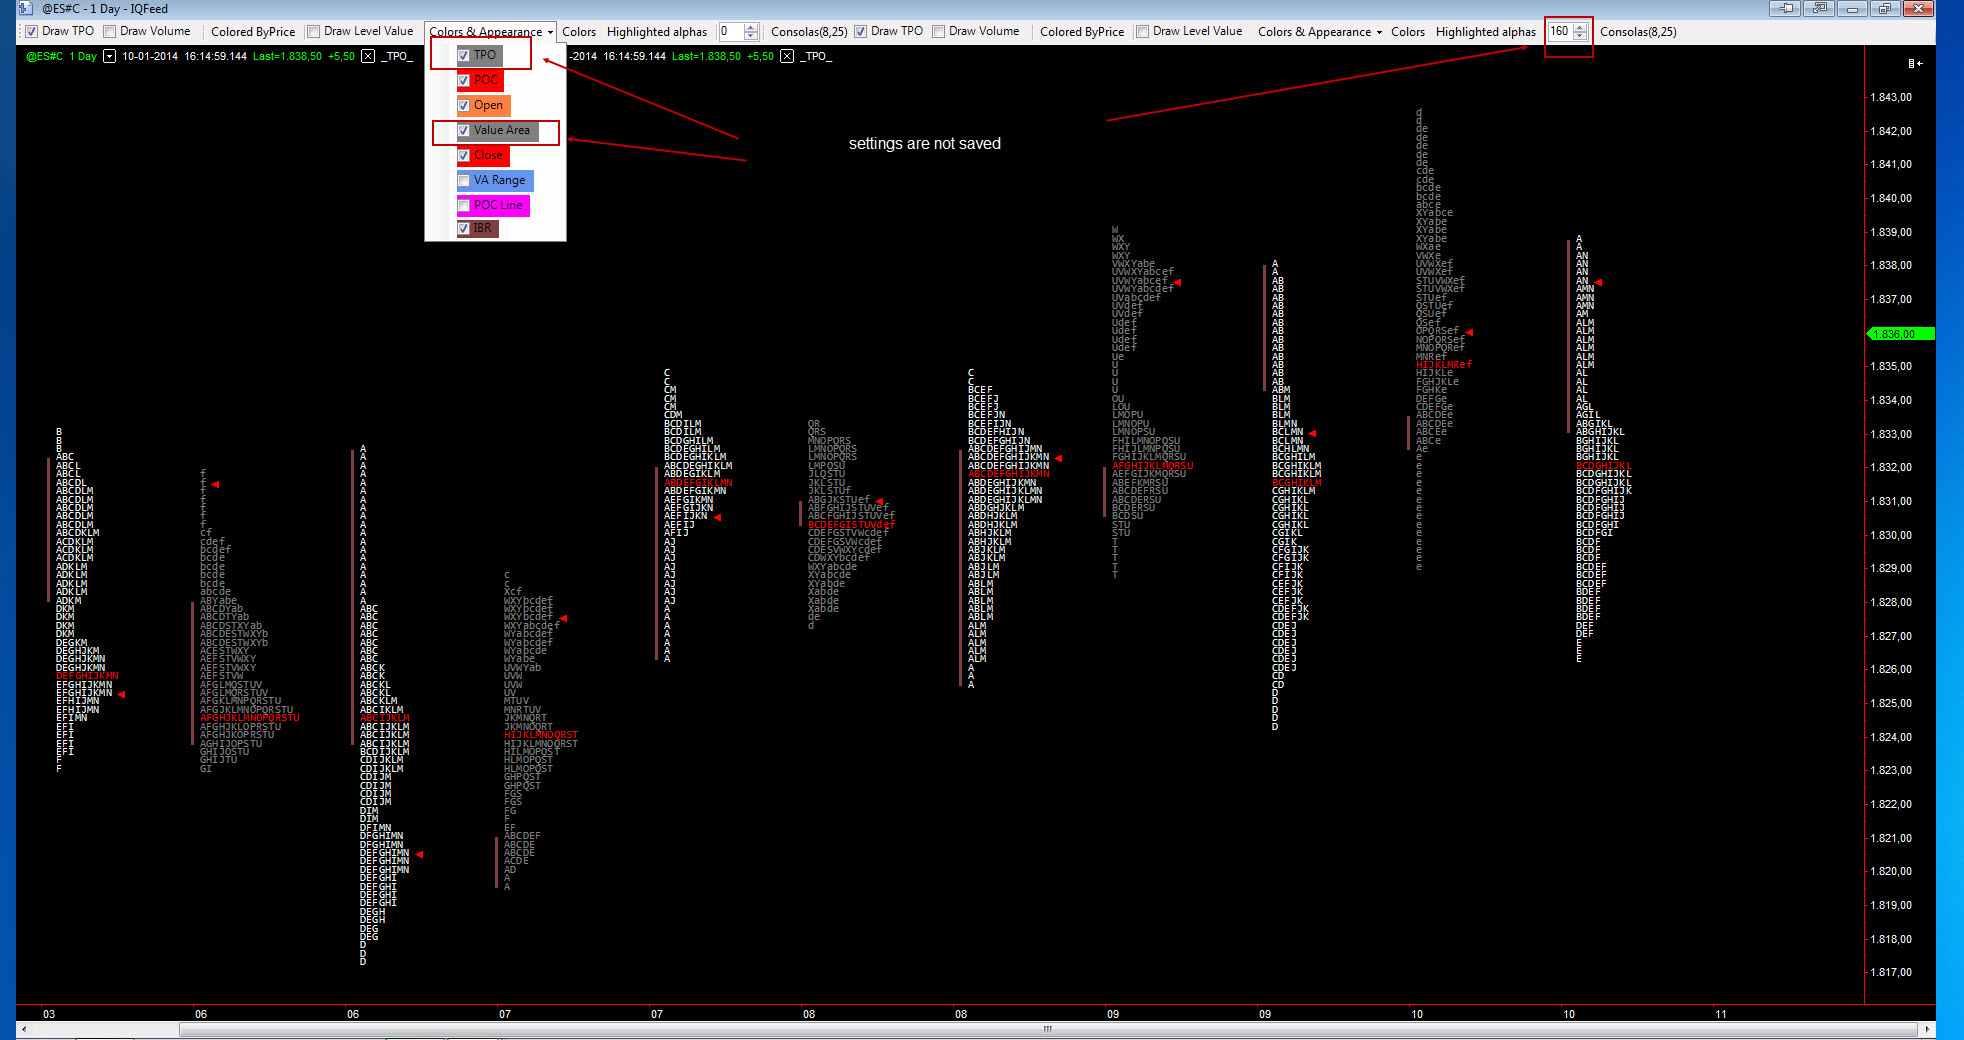
Here's another thing I've noticed. Don't know if this is a MC restriction or a study restriction.
It seems some settings are not being saved on exit.
In this chart I'm plotting two data series, one for RTH and another for ETH (due to the problem reported above, only plotting ETH data January 3rd forward).
ETH is colored darkgray while RTH is colored white.
Also, RTH has an offset of 160 otherwise ETH and RTH profiles would be on top of each other.
The color and the offset need to be set everytime I open MC. It's not saved when I close it.
Is it possible to fix this?
Regards.
- Attachments
-
- tpo_not_saved.jpg
- (392.08 KiB) Downloaded 15373 times
Re: TPO
Hello, arnie.
Could you attach the wsp with session template problem?Finaly I found what the problem is regarding the overnight profiles.
Is seems the code get confused by overnight sessions not starting at 5pm CT when the session template starts the session.
This feature has been implemented for "Squares" only.When we choose to highlight the open price we cannot see it on the chart
This is study restriction. Last changes of settings overrides previous one.Here's another thing I've noticed. Don't know if this is a MC restriction or a study restriction. It seems some settings are not being saved on exit.
- arnie
- Posts: 1594
- Joined: 11 Feb 2009
- Location: Portugal
- Has thanked: 481 times
- Been thanked: 514 times
Re: TPO
Attached.Could you attach the wsp with session template problem?
As you can see on the image, there's 3 charts there.
The chart on the right is the one showing the problem.
From Dec 26, where the ES opened at 500 and not at the regular time at 1700, there's no ETH profiles, only RTH.
The chart on the left chart, which has only loaded data from Jan 3 is plotting the ETH fine. Since that day the ETH session has started at its regular time, 1700.
Can you add it to "Alphas" also?This feature has been implemented for "Squares" only.
At least the colors should be allowed to be saved. It's a bit of a pain having to change the colors every time we open the workspace.This is study restriction. Last changes of settings overrides previous one.
- Attachments
-
- ES_TPO.wsp
- (549.07 KiB) Downloaded 780 times
-
- TPO_workspace.jpg
- (568.05 KiB) Downloaded 15397 times
- arnie
- Posts: 1594
- Joined: 11 Feb 2009
- Location: Portugal
- Has thanked: 481 times
- Been thanked: 514 times
Re: TPO
Something odd happening here these past days.
So far I only have seen this happening on the chart that has 2 data series, one for the ETH and the other for the RTH.
As you can see the RTH profiles (white) tends to disappear from time to time on the 2 data series chart and than come back seconds or minutes after.
Is this a MC issue or a code issue?
Regards
- Attachments
-
- tpo04.jpg
- (170.29 KiB) Downloaded 15360 times
-
- tpo03.jpg
- (134.19 KiB) Downloaded 15293 times
- arnie
- Posts: 1594
- Joined: 11 Feb 2009
- Location: Portugal
- Has thanked: 481 times
- Been thanked: 514 times
Re: TPO
I assume the study uses tick data because of the volume profile option that it has.
Is it possible to have a TPO study, without the volume profile option, where minute data could be used? It takes ages to load 30 days of data and while loading the data, it can consume 1.5gb of memory.
I don't see any reason why we need tick data to build TPO charts though I was able to change tick data keyword on the code for minute data. The profiles were built pretty fast but they had a lot of holes, indicating missing data. Since I had no idea what I was doing I stepped away.
- arnie
- Posts: 1594
- Joined: 11 Feb 2009
- Location: Portugal
- Has thanked: 481 times
- Been thanked: 514 times
Re: TPO
Getting back to message #30, where it was requested to set each period to 30min clock based
How hard would it be to create an option to merge an odd open with the nearest 30min period?
Treasuries open at 7:20 which give us 10min of data prior the 7:30 period start.
The best way to deal with this is to merge that initial 10min to the next 30min period. This would result the A period to start at 7:20 and end at 8:00. This would mean that the A period would have 40min total instead of the regular 30min.
At 8:00 B period would start, at 8:30 C period would start and so forth.
I did create a session template with one first session between 7:20 to 7:30 and a second session between 7:30 to 14:00. This at first seemed to be able to resolve the problem but than I noticed that if that initial 10min period high or low fall outside the period between 7:30 to 8:00, B period which starts at 8:00 when moving outside the A period, will plot on top of that initial 10min period. So instead of have 2 TPO's there, the profile continue to show only one since it's being plotted on top of it, giving this away an erroneous reading.
Regards,
Fernando
Re: TPO
Hi. There is new version of TPO study.
Implemented features:
1)
2)
3)
Implemented features:
1)
Input "TicksRoundUp" was added.It would be welcomed an input to set how many ticks to build the profiles."
2)
Input "UnderlyingResolution" was added.I assume the study uses tick data because of the volume profile option that it has.
Is it possible to have a TPO study, without the volume profile option, where minute data could be used? It takes ages to load 30 days of data and while loading the data, it can consume 1.5gb of memory.
3)
Settings are saved in the workspace.At least the colors should be allowed to be saved. It's a bit of a pain having to change the colors every time we open the workspace.
- Attachments
-
- TPO.pln
- (13.6 KiB) Downloaded 971 times
- arnie
- Posts: 1594
- Joined: 11 Feb 2009
- Location: Portugal
- Has thanked: 481 times
- Been thanked: 514 times
Re: TPO
Hi. There is new version of TPO study.
Implemented features:
1)Input "TicksRoundUp" was added.It would be welcomed an input to set how many ticks to build the profiles."
2)Input "UnderlyingResolution" was added.I assume the study uses tick data because of the volume profile option that it has.
Is it possible to have a TPO study, without the volume profile option, where minute data could be used? It takes ages to load 30 days of data and while loading the data, it can consume 1.5gb of memory.
3)Settings are saved in the workspace.At least the colors should be allowed to be saved. It's a bit of a pain having to change the colors every time we open the workspace.
Genius, absolutely genius
Not that I'm being picky here but you forgot to allow the alpha profile type to color the open price. It's the only thing that is missing for this to be PERFECT!
- Attachments
-
- tpo_new.jpg
- (190.91 KiB) Downloaded 15095 times
- arnie
- Posts: 1594
- Joined: 11 Feb 2009
- Location: Portugal
- Has thanked: 481 times
- Been thanked: 514 times
Re: TPO
It seems yesterday something happened since on the minute based profile some data were missed.
I had 2 profiles side by side, one tick and the other minute based and by the end of A period and the start of B period the minute based profile must have missed some data because it did not, as far as I could see, print 3 TPO's.
I reloaded the data and nothing happened.
Today, after load and reload the data several times and also copy and paste a couple of charts, the minute based profile finally got the missed data and now, tick and minute based profiles are identical.
I'll continue to monitor this behavior...
Historically speaking both profiles are identical, there's no divergence, only yesterday during live data I noticed this divergence.
- arnie
- Posts: 1594
- Joined: 11 Feb 2009
- Location: Portugal
- Has thanked: 481 times
- Been thanked: 514 times
Re: TPO
add on but found some strange things
1. the TPO display strange characters not alphas (currently use Arial narrow font)
2. "Draw volume" shows more than 10 decimal places
Please advise how to fix it. Thanks.
Could you attach smaller images? geez...
Why are you using the volume profile from the TPO study when you can use MC's built in solution which is far better?
Personally I would remove the volume option completely from the TPO study since, as you just saw, does a very poor job.
Regarding the TPO letters, that is indeed a strange thing.
What is your datafeed and the symbol you're applying the study?
Are you loading the TPO's based on tick or minute data?
Which the version of MC you're using?
Change the font to Microsoft Sans Serif or Consolas and see if that continues to happen.
Also, for market profiles we need to use monospaced (fixed width) fonts.
Re: TPO
add on but found some strange things
1. the TPO display strange characters not alphas (currently use Arial narrow font)
2. "Draw volume" shows more than 10 decimal places
Please advise how to fix it. Thanks.
Could you attach smaller images? geez...
Why are you using the volume profile from the TPO study when you can use MC's built in solution which is far better? It can give numbers. I don't know built in solution can provide it or not. Please advise.
Personally I would remove the volume option completely from the TPO study since, as you just saw, does a very poor job.
Regarding the TPO letters, that is indeed a strange thing.
What is your datafeed and the symbol you're applying the study? IB & HSIX14
Are you loading the TPO's based on tick or minute data? minute
Which the version of MC you're using? MC for TWS (IB)
Change the font to Microsoft Sans Serif or Consolas and see if that continues to happen. change to other fonts but remains the same
Also, for market profiles we need to use monospaced (fixed width) fonts.
Re: TPO
Hi all. My task is to make so-called TPO (Time Price Opportunity) indicator for new MC .NET platform. I will share the result with you. Your comments and suggestions are welcome.
Hi Dru,
I have tried MCTPO ver 2.0 in MC but cannot produce result generated by this indicator in MC .NET version. Also, MC draws a lot of resources in generation of market profile while MC .NET is very handy. Actually I like TPO for MC .net much. Do you have this one for MC? Thanks.
- Henry MultiСharts
- Posts: 9165
- Joined: 25 Aug 2011
- Has thanked: 1264 times
- Been thanked: 2957 times
Re: TPO
There is no way to have a similar TPO study in PowerLanguage due to the limitations of this language. If you like the TPO that is available for MultiCharts .NET then I would recommend to continue using it.Hi Dru,
I have tried MCTPO ver 2.0 in MC but cannot produce result generated by this indicator in MC .NET version. Also, MC draws a lot of resources in generation of market profile while MC .NET is very handy. Actually I like TPO for MC .net much. Do you have this one for MC? Thanks.
Re: TPO
Thank you Dru and MultiCharts for the excellent work which has been done to develop the TPO indicator from August 2012 onwards.
It is largely due to the success of this work that I decided to change my trading platform to MC.NET64, having tried to build a similar indicator myself on another trading platform (32 bit) before running into difficulties, due to the fact that the scripting language available was not powerful enough for the task. Clearly there are some studies which need to be scripted in C# and the TPO indicator is one such study.
Any person who has ever taken the time to study Market Profile theory will perhaps understand how potentially useful a TPO indicator can be, especially when superimposed on a Volume Profile study, which permits the trader to look back over long periods of time to see how the volume was distributed (see attached image).
In addition the MC TPO study shows the volume distribution on the first bar of the session (although unfortunately not on each bar of the session!), so the trader can see where the unfair price areas or extremes are forming relative to the longer- term, volume distribution on Volume Profile.
Any person interested in using this type of indicator for trading might benefit from studying Parts 1 and 2 of “A six-part study guide to Market Profile” which can be downloaded in PDF format from this link:
http://www.cmegroup.com/education/inter ... ndbook.pdf
However I believe that the TPO study should have its own Format TPO>Settings>Data Range which may be set independently from the Format Instrument>Settings>Data Range, so I have
submitted a feature request to MC PM (MC-1833) which can be found under the backlog section of the Project Management page.
If you are interested in using this indicator for trading, then please study the feature request and vote for the issue.
- Attachments
-
- TPO superimposed on Volume Profile for @FDAX.png
- TPO superimposed on Volume Profile
- (82.36 KiB) Downloaded 12765 times
- arnie
- Posts: 1594
- Joined: 11 Feb 2009
- Location: Portugal
- Has thanked: 481 times
- Been thanked: 514 times
Re: TPO
Thank you Dru and MultiCharts for the excellent work which has been done to develop the TPO indicator from August 2012 onwards.
It is largely due to the success of this work that I decided to change my trading platform to MC.NET64, having tried to build a similar indicator myself on another trading platform (32 bit) before running into difficulties, due to the fact that the scripting language available was not powerful enough for the task. Clearly there are some studies which need to be scripted in C# and the TPO indicator is one such study.
Any person who has ever taken the time to study Market Profile theory will perhaps understand how potentially useful a TPO indicator can be, especially when superimposed on a Volume Profile study, which permits the trader to look back over long periods of time to see how the volume was distributed (see attached image).
In addition the MC TPO study shows the volume distribution on the first bar of the session (although unfortunately not on each bar of the session!), so the trader can see where the unfair price areas or extremes are forming relative to the longer- term, volume distribution on Volume Profile.
Any person interested in using this type of indicator for trading might benefit from studying Parts 1 and 2 of “A six-part study guide to Market Profile” which can be downloaded in PDF format from this link:
http://www.cmegroup.com/education/inter ... ndbook.pdf
However I believe that the TPO study should have its own Format TPO>Settings>Data Range which may be set independently from the Format Instrument>Settings>Data Range, so I have
submitted a feature request to MC PM (MC-1833) which can be found under the backlog section of the Project Management page.
If you are interested in using this indicator for trading, then please study the feature request and vote for the issue.
Why are you using the VP option in the TPO study?
MC has built in a VP tool which is a lot easier to work with, loading a lot faster than the VP option of the TPO study. Personally I would remove the VP option from the TPO study.
What we need is a TPO built in tool with all market profile options which has been requested here:
https://www.multicharts.com/pm/viewissu ... no=MC-1307.
Although Dru's study is an awesome piece of work and I just can't live without it, it has many limitations if one wants to really take advantage of market profile reading.
If I understood your request you can achieve what you want by using another data series and "play" with the settings...
- Attachments
-
- tpo_example.jpg
- (169.93 KiB) Downloaded 14474 times
Re: TPO
Thank you Dru and MultiCharts for the excellent work which has been done to develop the TPO indicator from August 2012 onwards.
It is largely due to the success of this work that I decided to change my trading platform to MC.NET64, having tried to build a similar indicator myself on another trading platform (32 bit) before running into difficulties, due to the fact that the scripting language available was not powerful enough for the task. Clearly there are some studies which need to be scripted in C# and the TPO indicator is one such study.
Any person who has ever taken the time to study Market Profile theory will perhaps understand how potentially useful a TPO indicator can be, especially when superimposed on a Volume Profile study, which permits the trader to look back over long periods of time to see how the volume was distributed (see attached image).
In addition the MC TPO study shows the volume distribution on the first bar of the session (although unfortunately not on each bar of the session!), so the trader can see where the unfair price areas or extremes are forming relative to the longer- term, volume distribution on Volume Profile.
Any person interested in using this type of indicator for trading might benefit from studying Parts 1 and 2 of “A six-part study guide to Market Profile” which can be downloaded in PDF format from this link:
http://www.cmegroup.com/education/inter ... ndbook.pdf
However I believe that the TPO study should have its own Format TPO>Settings>Data Range which may be set independently from the Format Instrument>Settings>Data Range, so I have
submitted a feature request to MC PM (MC-1833) which can be found under the backlog section of the Project Management page.
If you are interested in using this indicator for trading, then please study the feature request and vote for the issue.
Why are you using the VP option in the TPO study?
MC has built in a VP tool which is a lot easier to work with, loading a lot faster than the VP option of the TPO study. Personally I would remove the VP option from the TPO study.
What we need is a TPO built in tool with all market profile options which has been requested here:
https://www.multicharts.com/pm/viewissu ... no=MC-1307.
Although Dru's study is an awesome piece of work and I just can't live without it, it has many limitations if one wants to really take advantage of market profile reading.
If I understood your request you can achieve what you want by using another data series and "play" with the settings...
Would you please advise how to configure the inputs in TPO indicator like ResNum, Precision.. etc in MC 64 in order to show the market profile graph as shown? I have no idea about the meaning of those parameters. Thanks.
- arnie
- Posts: 1594
- Joined: 11 Feb 2009
- Location: Portugal
- Has thanked: 481 times
- Been thanked: 514 times
Re: TPO
This is the .NET TPO version, not the PL version.Would you please advise how to configure the inputs in TPO indicator like ResNum, Precision.. etc in MC 64 in order to show the market profile graph as shown? I have no idea about the meaning of those parameters. Thanks.
Forget the PL TPO version. It's impossible to work with it. At least I was never able to make that plot a trustful profile.
Re: TPO
Arnie you should use both the built-in VP tool in MC.NET64 and the TPO VP study.
Use the built-in VP tool to look back as far as possible, even as much as three years back.
At present my built-in VP tool is looking back over only 13 weeks (using the Delta profile), since I have only recently purchased MC.NET and have not yet had time to experiment with the Format Instrument>Volume Profile>Time-Last setting.
However it's clear that a look-back period of merely 13 weeks will still provide excellent support/resistance levels for entry to the market on a LimitOrder with a small StopLoss.
So why use the TPO VP study? Because you will be able to see how the volume is being distributed on the current bar and in particular where the LOW VOLUME price areas are to be found. These are the price areas that I usually use to enter the market, because markets don't stay in low volume price areas for long! In Market Profile theory these low volume price areas are referred to as REJECTED EXCESS or UNFAIR price zones which may provide entry points to the market, so we need to retain the TPO VP study, or at least give the user the option to either turn it on or off.
However when using the TPO study as well as the built-in VP tool, you really only need to see the TPO study at the current bar. At present the TPO study look-back setting is the same as the Format Instrument>Volume Profile>Time-Last setting, which means that MC will normally have to build more than one TPO study. So for example if you were trading from a daily chart and the Format Instrument>Volume Profile>Time-Last setting = 13 weeks, then MC would have to build 13 x 5 = 65 TPO studies, when in fact you really only need one, based on the current bar!
In fact when more than one TPO study is displayed, it can become difficult to see the built-in VP study clearly, so the TPO study should have its own Format TPO>Settings>Data Range which would allow the user to display only the TPO studies that the user requires.
One other point is that if the chart resolution is less than daily, for example say 240 minutes, then the TPO study will only work for the first bar of the session, not for all of the bars, so the scripting needs to be updated to overcome this drawback.
I will study MC-1307 – thanks for giving this to me because I have not seen it before.
Re: TPO
I have been using this for a while, and I like it. A good basic TPO with volume and extensions for VAH and VAL. Thanks for this.
I would like to mention an ongoing issue though, often when I start MC the workspace with TPO chart wont load the TPO, and I get an error message. I have to delete the study then place it back into the chart then reset all my coulours and check volume etc, as if I never had it in the 1st place. It's not that bad really but it does this about 40-50% of the time, just an annoyance more than anything.
Does anyone else have this issue? It has done this with all of the MC updates/revisions for the last 6-8 months, not limited to 1 version.
- J
- arnie
- Posts: 1594
- Joined: 11 Feb 2009
- Location: Portugal
- Has thanked: 481 times
- Been thanked: 514 times
Re: TPO
Yes, it's a known issue.I have been using this for a while, and I like it. A good basic TPO with volume and extensions for VAH and VAL. Thanks for this.
I would like to mention an ongoing issue though, often when I start MC the workspace with TPO chart wont load the TPO, and I get an error message. I have to delete the study then place it back into the chart then reset all my coulours and check volume etc, as if I never had it in the 1st place. It's not that bad really but it does this about 40-50% of the time, just an annoyance more than anything.
Does anyone else have this issue? It has done this with all of the MC updates/revisions for the last 6-8 months, not limited to 1 version.
- J
You really don't need to delete the study.
Just switch the TPO study back ON.
When the study gives you the error it switchs OFF like any other study.
You can use the switch ON/OFF button in the status line or go to Format -> Study and get the status back ON.
Re: TPO
hi,
im unable to load this indicator.
not sure what the latest version is but i tried them all
i started a blank new 30 minute es chart (tried with tick charts as well)
at the top of the chart i see options for draw tpo, mirrored volume etc.
so something is working....
but all i see is default candles and this error
https://www.screencast.com/t/3nEEzj6R71f
any ideas?