3 colour volume histogram showing buy volume and sell volume
3 colour volume histogram showing buy volume and sell volume
Can anyone create this 3 colour volume histogram showing buy volume and sell volume similar to the one attached from NT that i found on net
- Attachments
-
- JEUVES 2.jpg
- (51.83 KiB) Downloaded 1383 times
-
Henry MultiСharts

- Posts: 9165
- Joined: 25 Aug 2011
- Has thanked: 1264 times
- Been thanked: 2957 times
Re: 3 colour volume histogram showing buy volume and sell vo
Hello nozjer786,
That won't be possible to do exactly the same display with PowerLanguage, but that is possible to show the required values on a chart. Such display can be programmed using MultiCharts .NET.
That won't be possible to do exactly the same display with PowerLanguage, but that is possible to show the required values on a chart. Such display can be programmed using MultiCharts .NET.
Re: 3 colour volume histogram showing buy volume and sell vo
i am ok with two sepaerate panes one showing buy volume other showing sell volume but pls give me a few lines of program to start with as i am beginner for programming
-
JoshM

- Posts: 2195
- Joined: 20 May 2011
- Location: The Netherlands
- Has thanked: 1544 times
- Been thanked: 1565 times
- Contact:
Re: 3 colour volume histogram showing buy volume and sell vo
As an alternative, you can stack histogram bars and play with `SetPlotWidth` to get "tower like" bars:
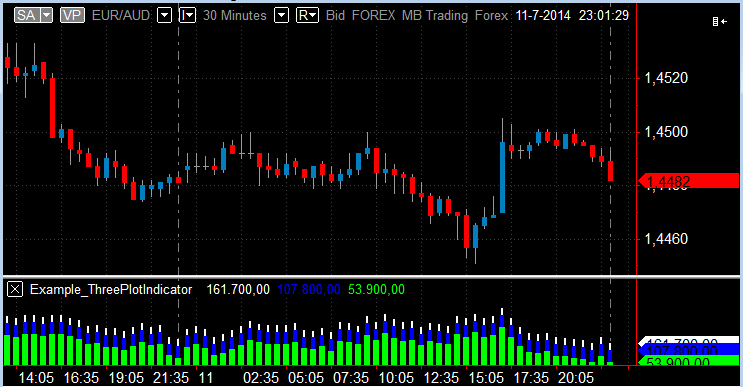
Code: Select all
if (BarStatus(1) = 2) then begin


	Plot1(UpTicks * 3);		// Start with the largest value for plot 1

	Plot2(UpTicks * 2);

	Plot3(UpTicks);


	SetPlotColor(1, White);

	SetPlotColor(2, Blue);

	SetPlotColor(3, Green);


	SetPlotWidth(1, 2);

	SetPlotWidth(2, 4);

	SetPlotWidth(3, 6);


end;
- Attachments
-
- scr.13-07-2014 11.25.01.png
- (9.57 KiB) Downloaded 1416 times