Download: suppres.ela
File Includes:
Indicator - Support-Resistance
Function - WRO
Function - WSO
Strategy - Support-Resistance
Category: indicator > Support & Resistance
Description:
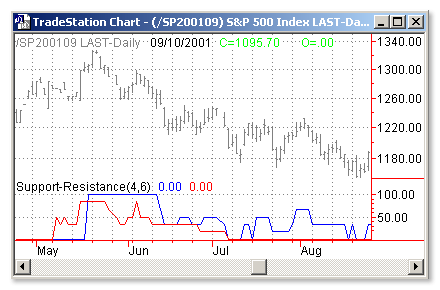
This indicator plots oscillators based on support/resistance approach.
Two oscillators are defined: the WSO (Widner support oscillator) and the WRO (Widner resistance oscillator). The WSO compares the current close with the most recent six support levels. Values range from zero to 100. WSO = zero means that the close is below all of the six support levels, and
WSO = 100 means that the current close is above all of the six support levels. Changes in WSO indicate changes in support, either breaking of an old level or establishing a new one. The WSO abd WRO are defined as:
Consequently, WSO and WRO can cross, but this is very uncommon.
Usage:
Enter long when support is strong and resistance is weak or enter when support is building.
I.e.: Enter long if WSO > simple moving average of WSO for the previous four bars or enter long if simple moving average of WRO for previous 30 days > 95
Go short vice versa.

Inputs:
Strength - pecifies required number of bars on either side of swing bar
Length - number of bars to calculate
EasyLanguage Code:
 INPUTS: STRENGTH(4), LENGTH(6);


PLOT1(WSO(STRENGTH, LENGTH), "SUPPORTOSC");

PLOT2(WRO(STRENGTH, LENGTH), "RESISTOSC");


{COPYRIGHT 1998 TECHNICAL ANALYSIS, INC.}