Download: FISHTRANSFOR.ELA
File Includes:
Indicator - Cycle analysis
Category:
Description:
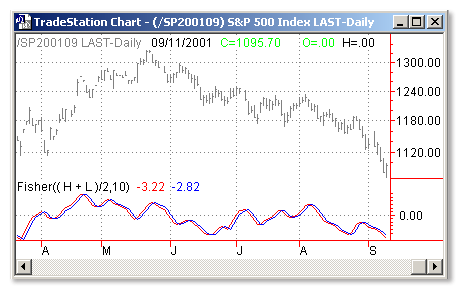
Market prices do not have a Gaussian probability density function as many traders think. Their probability curve is not bell-shaped. But trader can create a nearly Gaussian PDF for prices by normalizing them or creating a normalized indicator such as the relative strength index and applying the Fisher transform. Such a transformed output creates the peak swings as relatively rare events.
The sharp turning points of these peak swings clearly and unambiguously identify price reversals in a timely manner.
Usage:
If the prices are normalized to fall within the range from -1 to +1 and subjected to the Fisher transform, the extreme price movements are relatively rare events. This means the turning points can be clearly identified.

Inputs:
Len - number of bars to use in calculation
Price - data series to use in calculation
EasyLanguage Code:
Inputs: Price (( H + L )/2), Len (10);


Vars: MaxH(0), MinL(0), Fish(0);


MaxH = Highest (Price, Len);

MinL = Lowest (Price, Len);


Value1 = .33*2*((Price - MinL)/(MaxH - MinL) - 0.5) + 0.67*Value1[1];

If value1 > .99 then value1 = .999;

If value1 < - .99 then value1 = -.999;


Fish = .5*Log((1+Value1)/(1-Value1)) + .5*Fish[1];


Plot1(Fish, "Fisher");

Plot2(Fish[1], "Trigger");