Download: Tsi_etc.ela
File Includes:
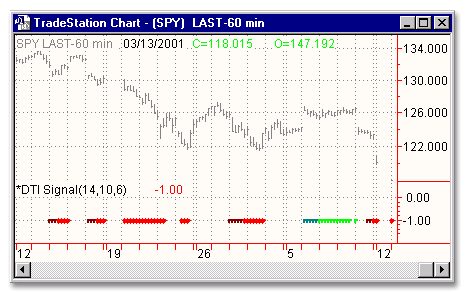
Indicator - *DTI Signal
Function - DTI
Function - DTI_Trade
Function - HMU
Function - LMD
Function - MDI
Function - TSI
Function - TVI
Function - DXAverage
Function - TXAverage
Indicator - DTI
Indicator - DTI_Trade
Indicator - Ergotic_CSI
Indicator - Ergotic_MACD
Indicator - Ergotic_MDI
Indicator - Ergotic_TSI
Indicator - Ergotic_TSI-2
Indicator - Ergotic_TVI
Category: Indicator > Miscellaneous
Description:
This is one of the techniques described by William Blau in his book "Momentum, Direction and Divergence" (1995). If you like to learn more, we advise you to read this book. His book focuses on three key aspects of trading: momentum, direction and divergence. Blau, who was an electrical engineer before becoming a trader, thoroughly examines the relationship between price and momentum in step-by-step examples. From this grounding, he then looks at the deficiencies in other oscillators and introduces some innovative techniques, including a fresh twist on Stochastics. On directional issues, he analyzes the intricacies of ADX and offers a unique approach to help define trending and non-trending periods.
Usage:
This is an indicator largely similar to ADX, i.e. it is used to determine the direction and strength of a trend.
Inputs:
r -
s -
u -
EasyLanguage Code:
{INSERT INDICATOR AT BOTTOM OF PRICE SUBGRAPH W SCALE = SCREEN OR PLACE IN ANY OTHER SUBGRAPH.}


INPUTS: R(14), S(10), U(6);


VARS: DTIVAR(0);


DTIVAR = DTI(R, S, U);


IF DTIVAR > 0 AND DTIVAR< 20 AND DTIVAR > DTIVAR[1] THEN

	PLOT1(-1, "DTIUP");


IF DTIVAR < 0 AND DTIVAR > -20 AND DTIVAR < DTIVAR[1] THEN

	PLOT2(-1, "DTIDN");


IF DTIVAR >= 20 AND DTIVAR > DTIVAR[1] THEN

	PLOT3(-1, "DTI20+");


IF DTIVAR <= -20 AND DTIVAR < DTIVAR[1] THEN

	PLOT4(-1, "DTI20-");