Download: williams.ela
File Includes:
Indicator - ABillW_ActiveFractal
Indicator - ABillW_3Lines
Indicator - ABillW_AC
Indicator - ABillW_AO
Indicator - ABillW_FractalLine
Indicator - ABillW_Alligator
Category: Indicator > Fractals
Description:
The 1st 2 chapters are somewhat of ramble where the author describes the "metaphysics" of trading. Still some good ideas are offered. The book references chaos theory, and leaves it up to the reader to believe whether "supercomputers" were used in formulating the various trading methods (the author wants to come across as an applied mathemetician, but he sure looks like a stock trader). There isn't any obvious connection with Chaos Theory - но не смотря на the weak link between the title and content, the trading methodologies do work. Most readers считают the author's systems to be a perfect filter and trigger for a short term trading system. He states a goal of 10%/month, but when these filters & axioms are correctly combined with a good momentum system, much more is a probable result.
There's better written & more informative books out there for less money, but this author does have the "Holy Grail" of stock trading. A set of filters, axioms, and methods which are the "missing link" for any trading system which is based upon conventional indicators.
Usage:
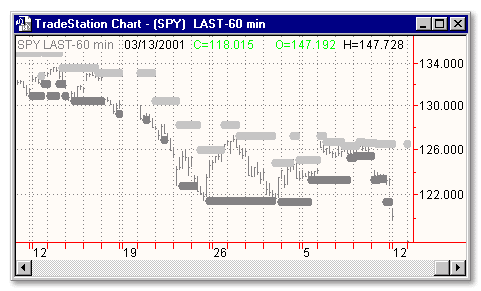
According to Bill Willams one should enter the market after a new price top (for long positions) or bottom (for short positions) has been penetrated. The identification of such a condition is based on determinig the validity of a fractal formation, where an upward fractal is identified when at least three consequent values are tops and after the local top at least two bars show a descent. So the model needs at least 5 bars of which the middle is the local top (upward fractal) or bottom (downward fractal).
This indicato highlights the periods suited for buying according to the fractal theory in Light Grey, and the periods suited for selling in Dark Grey.
EasyLanguage Code:
VARS:	BLBLUE(0),BLRED(0),BLGREEN(0),

		UPFRAC(0),DNFRAC(0),STP_NOW(FALSE),I1(0),MAXFRACSBACK(10);


VALUE0=(H+L)/2;

BLBLUE= AVERAGE(VALUE0,13)[8];	{BLUE}

BLRED=  AVERAGE(VALUE0,8)[5];		{RED}

BLGREEN=AVERAGE(VALUE0,5)[3];		{GREEN}


VALUE1=HIGHEST(H,3);

VALUE2=LOWEST(L,3);


STP_NOW=FALSE;

I1=1;

WHILE I1AND SWINGLOW(I1,L,2,80)<>-1 AND STP_NOW=FALSE

BEGIN

	VALUE3=SWINGLOW(I1,L,2,80);

	IF VALUE3>BLRED OR VALUE3>VALUE2

	THEN I1=I1+1

	ELSE STP_NOW=TRUE;

END;


IF STP_NOW

THEN DNFRAC=VALUE3

ELSE DNFRAC=-1;


STP_NOW=FALSE;

I1=1;

WHILE I1AND SWINGHIGH(I1,H,2,80)<>-1 AND STP_NOW=FALSE

BEGIN

	VALUE4=SWINGHIGH(I1,H,2,80);

	IF VALUE4OR VALUE4	THEN I1=I1+1

	ELSE STP_NOW=TRUE;

IF DATE=930219 THEN PRINT(D," OOH ",I1,STP_NOW,VALUE4);


END;


IF STP_NOW

THEN UPFRAC=VALUE4

ELSE UPFRAC=-1;


IF UPFRAC<>0 AND UPFRAC<>-1 THEN PLOT1(UPFRAC,"UPFRACT");

IF DNFRAC<>0 AND DNFRAC<>-1 THEN PLOT2(DNFRAC,"DNFRACT");