Drawing Tools can be applied, moved, and formatted, directly on a chart, providing tremendous flexibility. Many drawing tools allow you to analyze new data on a chart by extending the drawing object to the left or to the right of the chart. You can use them to call attention to any area of a chart you wish.
Description:
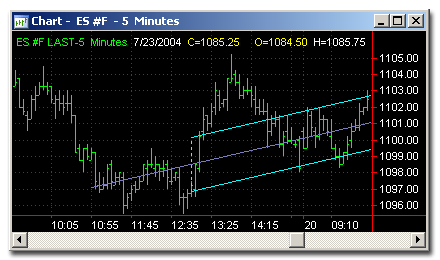
This tool is 3 parallel lines slanted to the right. The location of origin points defines the inclination and channel width. You can manage the object visually and by setting the exact parameter values.

Usage:
The interpretation of a pitchfork is based on normal trendline support and resistance principles.
Typically, the pitchfork is created on a chart as follows:
The first trendline begins at the left-most point selected (either a major peak or trough) and is drawn so it passes directly between the two right-most points. This line is the "handle" of the pitchfork.
The second and third trendlines are then drawn beginning at the two right-most points (a major peak and a major trough) and are drawn parallel to the first line. These lines are the "tines" of the pitchfork.