For some the most important factor is net profit, for some - minimal drawdowns, some do not like to use a MTS which yields only a small percentage of profitable deals. Which system to choose? What parameters to set? A great variety of approaches exist and so every MTS developer sets to choose the methods most fitting his trading preferences and personal qualities.
Optimization
First of all we should mention optimization - an important but controversial aspect of MTS development. There exists a widespread opinion "the less a system has been optimized, the more robust will it be in the future". There are even steady opponents of any optimization, but making a decision not to optimize some of the MTS' parameters, the developer will intentionally narrow the bounds outside which the trading results might be significantly improved. We do not agree with un-optimized MTS development, but one should be aware that every optimization brings in the risk of equity curve fitting.
|
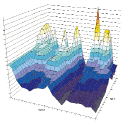
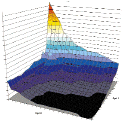
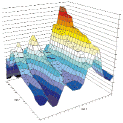
Profit or robustness? After we carry out some tests and find out that some values of the parameters optimized provide maximal profits during backtesting using historical data, can we expect this to repeat in the future? We probably won't be mistaken if we say that optimization is not meant to find the maximal profit parameters based on historical data. Optimization is more of a searching for a certain range of values, within which the profits would be acceptable and predictable. It is searching for a compromise between two eternal rivals - maximal profit and robustness of a trading system. The robustness of a system is the quality that allows to expect in the future a result close to backtesting results. An unstable MTS in case of a minor market shift may produce results much worse compared to backtesting history. There is practically no way to evaluate robustness using standard means implemented in technical analysis software like Omega TradeStation, yet approximation methods do exist. The most widely used now ones are the "Out-Of-Sample" method and "Walk-Forward" optimization. We'd like to offer a visual analysis of a system's optimization results 3D surface chart for robustness evaluation. This method also allows to measure the influence of a given parameter on the system's profits and define the scaling of the selection to be optimized - an important benefit for MTS development. Looking ahead we should mention that this method can be used to evaluate any of a system's profit parameters, such as the Profit Factor, PercentProfitable, Avg.Win/Loss, Max. DrawDown and others, but for simplicity the approach will be termed "Visual analysis of profit surfaces". To plot the 3D surface we use the Online RobustnessChart utility, plotting the parameter values to be optimized on the X and Y axes and the system output (NetProfit, Profit Factor, Percent Profitable, Avg.Win/Loss, Max. DrawDown) on the Z axis. The visual a analysis of profit surfaces has an advantage over other methods of MTS parameter evaluation. Fist of all, quickly, literally at a glance one can guess how much every of the parameters being optimized influences the system's profit, how much the maximal profit value differs from the average, with which parameters the system may never be allowed to trade and so on. The steepness or flatness of the surface slopes, location of peaks and depressions all bear direct or indirect indications to the system robustness. The first signs of instability may be found in certain areas in the form of profit leaps when the amount of trades is small. After looking at the surface from different angles one can quickly decide how correct are the optimization limits, aren't the increments of parameters too small or large, shouldn't perhaps the whole parameter set be moved sideways. An important benefit of visual analysis of profit surfaces is the abovementioned ability of analyzing any income parameters. If one plots a set of surfaces for NetProfit, Profit Factor, Percent Profitable, Avg.Win/Loss, Max. DrawDown one can easily define common zones on all plots, where every profit parameter will have an acceptable value and comply with our trading preferences. It is evident that that approaches to surface analysis may be completely different, but some points may be deemed general: 1. Any pointed peaks on the surface signify certain instability in those points and the casual nature of profit results in them. You'll hardly want to trade a system where a change in the parameter by one increment can "drop" the profit down by tens of percents (picture 1). 2. A surface gently sloping from the extreme value point will probably indicate a good result. 3. If the maximal income values are clustered in a small zone of the surface, this may mean that the optimization range and increments are much too large. Decrease them and have a look at the surface in "larger" resolution. At a certain resolution any peak may be turned into a flat, and any flat area into a peak (picture 2). 4. Sometimes one can see pronounced "mountain ranges" on the surfaces. This most often means the system has an increased sensitivity to changes of one parameter and decreased sensitivity to changes of another. If the "range" runs parallel to an axis, it is possible to just exclude it from the analysis - or check its scale selection more thoroughly. "Ranges" and "canyons" that are not parallel to axes mean more complex parameter interaction also worthy of attention (picture 3). |

Picture1 
Picture2 
Picture3 |
Conclusions
The methods of visual analysis of profit surfaces may well find its place among other ways of system parameter evaluation. Its advantages include highly demonstrative results, simple interpretation and logically sound conclusions. After testing a multitude of systems with the surface analysis we were pleased to confirm the possibility to exclude faulty (despite impressive net profit) systems quickly and so concentrate on fine-tuning the parameters of promising systems.
N other method allows evaluating in such a speedy way the reliability of the parameter's values and the optimization increments. The danger of Over-Curve-Fitting is greatly decreased due to a holistic approach to the parameters and their influence on the system's profit.
The drawbacks of the visual analysis of profit surfaces are related to the somewhat subjective evaluation - same as with the classic technical analysis using patterns. Every user or developer may have a personal approach to surface interpretation, for instance the well-known 3D SmartView program by Rina Systems uses "slope steepness" as an indicator of robust zones.