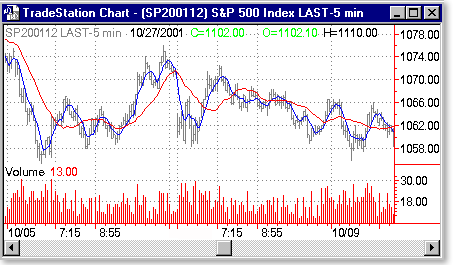
Download: Buffavg.ela
File Includes:
Indicator - Buff Averages
Function - Buff Average
Category: Indicator > Averages
Description:
The indicator plots two moving averages based on the day.s price and volume. The Buff moving average for n days is calculated according to the formula:

where VolSum is the sum of all Volume for n days.
Usage:
The most popular method of interpreting a moving average is to compare the relationship between a moving average of the security's price with the security's price itself (or between two different moving averages). A buy signal is generated when the security's price rises above its moving average and a sell signal is generated when the security's price falls below its moving average.

Inputs:
Price - the data series to average
FastAvg - the parameter tells how many bars to the FastAvg average
SlowAvg - the parameter tells how many bars to the SlowAvg average
EasyLanguage Code:
INPUTS: PRICE(CLOSE), FASTAVG(5), SLOWAVG(20);


PLOT1(BUFFAVERAGE(PRICE, FASTAVG), "FASTBUFF");

PLOT2(BUFFAVERAGE(PRICE, SLOWAVG), "SLOWBUFF");


IF PLOT1 CROSSES ABOVE PLOT2 THEN

	ALERT("BUFF AVERAGES BULLISH CROSSOVER.");

IF PLOT1 CROSSES BELOW PLOT2 THEN

	ALERT("BUFF AVERAGES BEARISH CROSSOVER.");