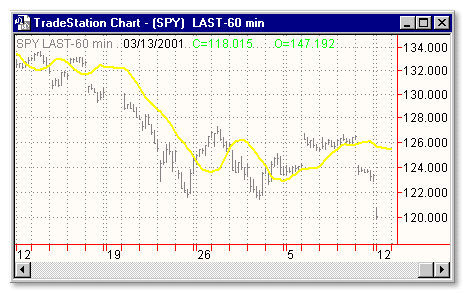
Download: diswavg.ela
File Includes: Indicator - Displaced Weighted Moving Average
Category: Indicator > Average
Description:
Displaced moving averages plot the moving average values of a previous bar or later bar on the current bar.
A weighted moving average is designed to put more weight on recent data and less weight on past data. A weighted moving average is calculated by multiplying each of the previous day's data by a weight. The following table shows the calculation of a 5-day weighted moving average:
| Day # | Weight | Price | Weighted Average | ||||||
| 1 | 1 | * | 25.00 | = | 25.00 | ||||
| 2 | 2 | * | 26.00 | = | 52.00 | ||||
| 3 | 3 | * | 28.00 | = | 84.00 | ||||
| 4 | 4 | * | 25.00 | = | 100.00 | ||||
| 5 | 5 | * | 29.00 | = | 145.00 | ||||
| Totals: | 15 | * | 133.00 | = | 406.00 | / | 15 | = | 27.067 |
The weight is based on the number of days in the moving average. In the above example, the weight on the first day is 1.0 while the value on the most recent day is 5.0. This gives five times more weight to today's price than the price five days ago.
Usage:
The most popular method of interpreting a moving average is to compare the relationship between a moving average of the security's price with the security's price itself (or between several moving averages).

Inputs:
Price - the data series to average
Length - the parameter tells how many bars to average
Displace - number of bars to displace the plot of the moving average
EasyLanguage Code:
INPUT : PRICE(CLOSE), LENGTH(9), DISPLACE(5);


IF DISPLACE >= 0 THEN BEGIN

  IF CURRENTBAR > DISPLACE THEN

   PLOT1(WAVERAGE(PRICE,LENGTH)[DISPLACE],"AVGDISPLACE");

END;


IF DISPLACE < 0 THEN BEGIN

  IF CURRENTBAR > ABSVALUE(DISPLACE) THEN

   PLOT1[WABSVALUE(DISPLACE)](AVERAGE(PRICE,LENGTH),"AVGDISPLACE");

END;