Download: tema.ELA
File Includes: Indicator - TEMA1
Category: Indicator > Averages
Description:
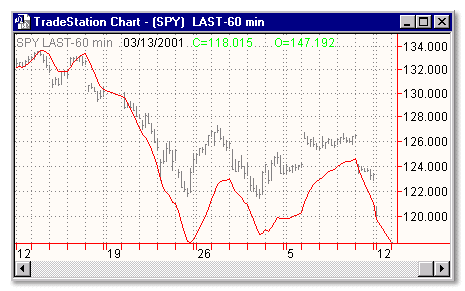
This study plots the TEMA1 indicator. TEMA1 ia s triple MA (Moving Average), and is calculated as 3*MA - (3*MA(MA)) + (MA(MA(MA)))
Usage:
The most popular method of interpreting a moving average is to compare the relationship between a moving average of the security's price with the security's price itself (or between several moving averages).

Inputs:
Price - the data series to average
Length - the parameter tells how many bars to average
EasyLanguage Code:
INPUTS:  PRICE(CLOSE),LENGTH(26);

VARS:  TEMA1(0);


TEMA1 =  (3 * XAVERAGE(PRICE,LENGTH)) - (3 * XAVERAGE(XAVERAGE(PRICE,LENGTH),LENGTH)) +

	(XAVERAGE(XAVERAGE(XAVERAGE(PRICE,LENGTH),LENGTH),LENGTH));


PLOT1(TEMA1,"TEMA1");