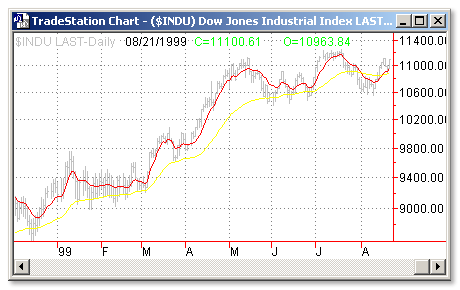
Download: vidya2.ela
File Includes:
Indicator - VIDYA2 (StdDev)
Function - StdDevVidya
Category: Indicator > Averages
Description:
This indicator plots two Variable Index Adjusted Moving Averages (VIDYA),based on StdDev of prices as a measure of volatility on the same chart.
VIDYA is calculated according to this formula:
where:
Alpha - numerical constant (corresponding roughly to a
x-week exponential moving average)
StdDev(ref) - Average mean of StdDev for n periods
VIDYA tracks the market better than exponential moving averages do using a fixed smoothing constant. Trading strategies based on VIDYA should perform better than those based on exponential moving averages
Usage:
The most popular method of interpreting a moving average is to compare the relationship between a moving average of the security's price with the security's price itself (or between several moving averages).

Inputs:
Alpha1 - numerical constant for fast VIDYA
Alpha2 - numerical constant for slow VIDYA
Price - price data to use
Lenght - number of bars to calculate
EasyLanguage Code:
INPUT: ALPHA1(0.2),ALPHA2(0.04),PRICE(CLOSE),LENGTH(20);

PLOT1(STDDEVVIDYA(ALPHA1,PRICE,LENGTH),"PLOT1");

PLOT2(STDDEVVIDYA(ALPHA2,PRICE,LENGTH),"PLOT2");

IF CHECKALERT THEN BEGIN

  IF PLOT1 CROSSES ABOVE PLOT2 OR PLOT1 CROSSES BELOW PLOT2

  THEN ALERT;

END;