Download: bbo.ELA
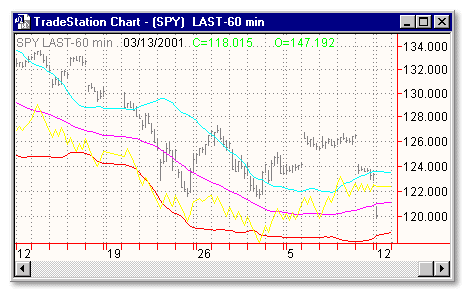
File Includes: Indicator - BollingerBand on OBV
Category: Indicator > Bands
Description:
As with moving average envelopes, the basic interpretation of Bollinger Bands is that prices tend to stay within the upper- and lower-band. The distinctive characteristic of Bollinger Bands is that the spacing between the bands varies based on the volatility of the prices. During periods of extreme price changes (i.e., high volatility), the bands widen to become more forgiving. During periods of stagnant pricing (i.e., low volatility), the bands narrow to contain prices.
On Balance Volume is a running total of volume. It shows if volume is flowing into or out of a security. When the security closes higher than the previous close, all of the day's volume is considered up-volume. When the security closes lower than the previous close, all of the day's volume is considered down-volume.
Once a trend is established, it remains in force until it is broken. There are two ways in which the OBV trend can be broken. The first occurs when the trend changes from a rising trend to a falling trend, or from a falling trend to a rising trend. The second way the OBV trend can be broken is if the trend changes to a doubtful trend and remains doubtful for more than three days.
Usage:
Bands define the upper and lower boundaries of a security's normal trading range. A sell signal is generated when the security reaches the upper band whereas a buy signal is generated at the lower band. The optimum percentage shift depends on the volatility of the security--the more volatile, the larger the percentage.
The logic behind bands is that overzealous buyers and sellers push the price to the extremes (i.e., the upper and lower bands), at which point the prices often stabilize by moving to more realistic levels.
There are two kinds of bands: envelops and Bollinger bands.
The difference between Bollinger bands and envelopes is envelopes are plotted at a fixed percentage above and below a moving average, whereas Bollinger bands are plotted at standard deviation levels above and below a moving average. Since standard deviation is a measure of volatility, the bands are self-adjusting: widening during volatile markets and contracting during calmer periods. Bollinger Bands were created by John Bollinger.

Inputs:
Price - specifies which price of the asset to use
Length - number of trailing bars to average
StdDevUp - number of standard deviations to offset вверх
StdDevDn - number of standard deviations to offset вниз
EasyLanguage Code:
INPUT: PRICE(OBV),LENGTH(40),STDDEVUP(2),STDDEVDN(-2);

PLOT1(BOLLINGERBAND(PRICE,LENGTH,STDDEVUP),"BOLLTOP");

PLOT2(BOLLINGERBAND(PRICE,LENGTH,STDDEVDN),"BOLLBOT");

PLOT3(AVERAGE(PRICE,LENGTH),"AVERAGE");

PLOT4(OBV,"OBV");

IF CHECKALERT THEN BEGIN

  IF PLOT1 CROSSES ABOVE PLOT2 OR PLOT1 CROSSES BELOW PLOT2

  OR PLOT1 CROSSES ABOVE PLOT3 OR PLOT1 CROSSES BELOW PLOT3

  OR PLOT1 CROSSES ABOVE PLOT4 OR PLOT1 CROSSES BELOW PLOT4

  OR PLOT2 CROSSES ABOVE PLOT3 OR PLOT2 CROSSES BELOW PLOT3

  OR PLOT2 CROSSES ABOVE PLOT4 OR PLOT2 CROSSES BELOW PLOT4

  OR PLOT3 CROSSES ABOVE PLOT4 OR PLOT3 CROSSES BELOW PLOT4

  THEN ALERT;

END;