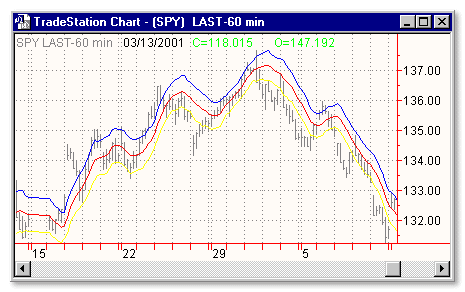
Category: Indicator > Bands
Description:
This is another indicator for plotting of the Keltner Channel. Keltner channels help you identify market trends. Keltner channels compare today's prices with yesterday's prices. An absence of new highs indicates a down trend. An absence of new lows indicates an up trend. In conjunction with this method of trend identification, the Minor-Trend Rule is used. The Minor Trend Rule states that the minor trend is bullish if the daily trend sells above its most recent high: conversely, the minor trend is bearish if the daily trend sells below its most recent low.
A Keltner channel study consists of a moving average and two channel lines. The channel lines are drawn by adding to and subtracting from the current moving average value the product of a constant multiplied by the average true range of each bar.
Usage:
Bands define the upper and lower boundaries of a security's normal trading range. A sell signal is generated when the security reaches the upper band whereas a buy signal is generated at the lower band. The optimum percentage shift depends on the volatility of the security--the more volatile, the larger the percentage.
The logic behind bands is that overzealous buyers and sellers push the price to the extremes (i.e., the upper and lower bands), at which point the prices often stabilize by moving to more realistic levels.
There are two kinds of bands: envelops and Bollinger bands.
The difference between Bollinger bands and envelopes is envelopes are plotted at a fixed percentage above and below a moving average, whereas Bollinger bands are plotted at standard deviation levels above and below a moving average. Since standard deviation is a measure of volatility, the bands are self-adjusting: widening during volatile markets and contracting during calmer periods. Bollinger Bands were created by John Bollinger.

Inputs:
Price - specifies which price of the asset to use
MaLen - number of trailing bars to average
Const - a multiplier applied to the current bar’s range. The Factor will be positive for the upper band and negative for the lower band.
EasyLanguage Code:
INPUTS: PRICE(CLOSE),MALEN(10),CONST_(.8);

VARS: CENTLINE(0), AVGRANGE(0), UPPER(0), LOWER_(0);


CENTLINE=AVERAGE(PRICE,MALEN);

AVGRANGE=AVERAGE(TRUERANGE,MALEN);

UPPER=CENTLINE+(AVGRANGE*CONST_);

LOWER_=CENTLINE-(AVGRANGE*CONST_);


PLOT1(CENTLINE,"CENTLINE");

PLOT2(UPPER,"UPPER");

PLOT3(LOWER_,"LOWER");