Download: narrow.ela
File Includes: Indicator - Narrow Sideways Chan
Category: Indicator > Bands
Description:
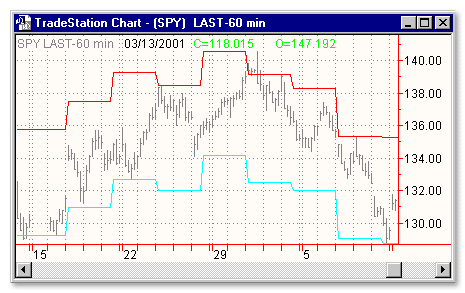
This study plots Narrow Sideway Channel. Sometimes the market does not trend up or down but side to side. Since the definition of an Uptrend is Higher HIGHs and Lower LOWs, and the definition of a Downtrend is Lower LOWs and Lower HIGHs, it is only logical that the definition of a Sideways Channel is roughly matching HIGHs and LOWs.
The Narrow Sideways Channel (or Trading Range) can be identified when the market makes roughly matching support and resistance points. Trading Ranges usually occur because of apathy in the marketplace, so the forces of supply and demand are temporarily balanced. These situations can last for prolonged periods of time, but eventually a factor will change and prices will resume a trend up or down. The change of trend from sideways to either bullish or bearish is signaled when prices penetrate either extreme of the trading range. The important factor to look for is two or more matching support points and two or more roughly matching resistance points. Violation of either the support area or resistance area signals the start of a new trend.
Usage:
Bands define the upper and lower boundaries of a security's normal trading range. A sell signal is generated when the security reaches the upper band whereas a buy signal is generated at the lower band. The optimum percentage shift depends on the volatility of the security--the more volatile, the larger the percentage.
The logic behind bands is that overzealous buyers and sellers push the price to the extremes (i.e., the upper and lower bands), at which point the prices often stabilize by moving to more realistic levels.
There are two kinds of bands: envelops and Bollinger bands.
The difference between Bollinger bands and envelopes is envelopes are plotted at a fixed percentage above and below a moving average, whereas Bollinger bands are plotted at standard deviation levels above and below a moving average. Since standard deviation is a measure of volatility, the bands are self-adjusting: widening during volatile markets and contracting during calmer periods. Bollinger Bands were created by John Bollinger.

Inputs:
Chalen - number of trailing bars to calculate
Chamarge - required distance from High and Low
Charange - required value of range
EasyLanguage Code:
INPUT:CHALEN(15),CHAMARGE(3),CHARANGE(3);

VARS:CHALENV(CHALEN + 1);


IF RANGE < CHARANGE THEN BEGIN


FOR VALUE1 = CHALENV  DOWNTO 0 BEGIN

     IF H[VALUE1] < H + CHAMARGE AND BARNUMBER[VALUE1] > VALUE20 THEN

           VALUE2 = VALUE2 + 1 ELSE BEGIN

           VALUE2 = 0; VALUE3 = 0; END;

     IF L[VALUE1] > L - CHAMARGE AND BARNUMBER[VALUE1] > VALUE20 THEN

           VALUE3 = VALUE3 + 1 ELSE BEGIN

           VALUE2 = 0; VALUE3 = 0; END;

END;


IF VALUE2 = CHALENV - 1 AND VALUE3 = CHALENV -1 THEN BEGIN

     FOR VALUE4 = CHALENV - 2 DOWNTO  0 BEGIN

           PLOT1[VALUE4](H + CHAMARGE,"ULINE");

           PLOT2[VALUE4](L - CHAMARGE,"DLINE");

           VALUE20 = BARNUMBER;

           VALUE21 = H + CHAMARGE;

           VALUE22 = L - CHAMARGE;

     END;

END;


VALUE2 = 0;

VALUE3 = 0;


IF VALUE21 > 0 AND  H CROSSES OVER VALUE21 THEN  ALERT = TRUE;

IF VALUE22 > 0 AND L CROSSES UNDER VALUE22 THEN  ALERT = TRUE;


END;


{WHEN DONE, SET THE STYLE UNDER PROPERTIES TO POINT, VERY THIN, THAT WILL LOOK BETTER.}