Download: Nmp.ela
File Includes:
Indicator - NewMarketParadigm E
Function - NewMarketParadigm
Indicator - NewMarketParadigm C
PaintBar - NMP Contraction
PaintBar - NMO Expansion
Strategy - NMP System
Strategy - NMP System--original
Category: Indicator > Bands
Description:
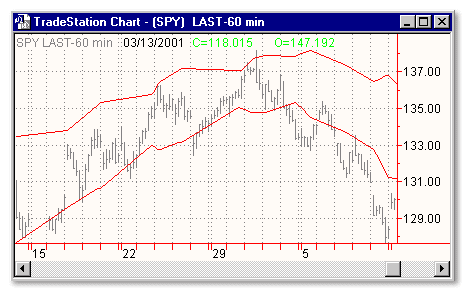
New Market Paradigm is a market conception, based on Variable mutation idea. Variable mutation is a changing of set of variables to being used depending on current market structure.
Expansion — A phase defined by a significant increase in price momentum and extreme directional price action. If the previous phase was a contraction phase, then the expansion phase would be considered correct.
Please read the article to learn more.
Usage:
Bands define the upper and lower boundaries of a security's normal trading range. A sell signal is generated when the security reaches the upper band whereas a buy signal is generated at the lower band. The optimum percentage shift depends on the volatility of the security--the more volatile, the larger the percentage.
The logic behind bands is that overzealous buyers and sellers push the price to the extremes (i.e., the upper and lower bands), at which point the prices often stabilize by moving to more realistic levels.
There are two kinds of bands: envelops and Bollinger bands.
The difference between Bollinger bands and envelopes is envelopes are plotted at a fixed percentage above and below a moving average, whereas Bollinger bands are plotted at standard deviation levels above and below a moving average. Since standard deviation is a measure of volatility, the bands are self-adjusting: widening during volatile markets and contracting during calmer periods. Bollinger Bands were created by John Bollinger.

Inputs:
Price - specifies which price of the asset to use
Length - number of trailing bars to average
StdDevUp - number of standard deviations to offset вверх
StdDevDn - number of standard deviations to offset вниз
EasyLanguage Code:
INPUTS: PRICE(CLOSE), LENGTH(28), STDDEVUP(2), STDDEVDN(-2);


VALUE1 = BOLLINGERBAND(PRICE, LENGTH, STDDEVUP);

VALUE2 = BOLLINGERBAND(PRICE, LENGTH, STDDEVDN);


IF NEWMARKETPARADIGM(PRICE, LENGTH, STDDEVUP, STDDEVDN) = 2 THEN BEGIN

	PLOT1(VALUE1, "NMP E");

	PLOT2(VALUE2, "NMP E");

END;


{COPYRIGHT 1998 TECHNICAL ANALYSIS, INC.}