Download: SEB STDERR BANDS.ELA
File Includes:
Indicator - SEB Std. Error Bnds
Function - CalcA
Function - CalcB
Category: Bands > SEB Std. Error Bnds
Description:
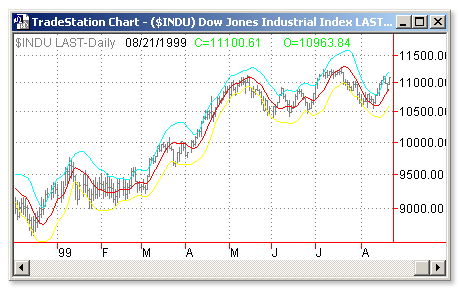
The construction of standard error bands is similar to that of Bollinger bands. The difference: nstead of measuring the variance or degree of volatility around the average price using the standard deviation, standard error bands require the use of the standard error of the estimate around a 21-period linear regression line (Figure 1). The middle band is calculated as the ending value of a 21-period linear regression line and adding two standard errors to the ending value of the regression line to form the upper standard error band. To form the lower standard error band, subtract two standard errors from the end value of the linear regression line.
This indicator is calculated according to this formula:
Lower Band = SmoothedRegressionLine (EndPointOfRegression of Close Price,SDeg) - 2 x SmoothedStdError
Usage:
Bands define the upper and lower boundaries of a security's normal trading range. A sell signal is generated when the security reaches the upper band whereas a buy signal is generated at the lower band. The optimum percentage shift depends on the volatility of the security--the more volatile, the larger the percentage.
The logic behind bands is that overzealous buyers and sellers push the price to the extremes (i.e., the upper and lower bands), at which point the prices often stabilize by moving to more realistic levels.

Inputs:
Lenght - number of bars used in LinRegValue calculation
SDeg - number of bars used in smoothed StdError calculation
EasyLanguage Code:
INPUTS: LENGTH(21), SDEG(3);

VARS: LINREGY(0), X(0), STDERR(0), LINREGS(0), SERR(0);


LINREGY = LINEARREGVALUE(CLOSE, LENGTH, 0);

X = CURRENTBAR;


IF CURRENTBAR > LENGTH THEN BEGIN

	VALUE1 = (SUMMATION(SQUARE(CLOSE), LENGTH)) - ((CALCA(LENGTH) * SUMMATION(CLOSE, LENGTH))) -

		((CALCB(LENGTH) * SUMMATION(X * CLOSE, LENGTH)));

	VALUE2 = LENGTH - 2;

	VALUE3 = (VALUE1 / VALUE2);

	IF VALUE3 > 0 THEN

		STDERR = SQUAREROOT(VALUE1 / VALUE2)

	ELSE

		STDERR = STDERR[1];

	PRINT(DATE, "GAS =  ", STDERR);

	LINREGS = AVERAGE(LINREGY, SDEG);

	SERR = 2 * AVERAGE(STDERR, SDEG);


	PLOT1(LINREGS, "LINREGS");

	PLOT2(LINREGS + SERR, "+STDERRS");

	PLOT3(LINREGS - SERR, "-STDERRS");

END;


{COPYRIGHT C 1997, TECHNICAL ANALYSIS, INC.}