Download: LUNARCICLE.ELA
File Includes:
Indicator - LUNARCICLE
Function - LUNARCICLE
Category: Indicator > Cycle Analysis
Description:
Plots a dot every 27 days so if you type a full moon date as the input, it will continue to show you full moon days.
NOTE: Date should be entered as YYMMDD.
Usage:
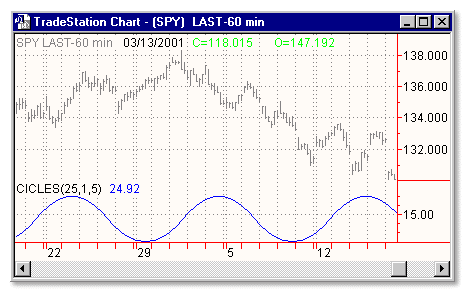
The most popular method of using a cycle is to accurately predict events in nature: bird migrations, the tides, planetary movements, etc. One can also use cycle analysis to predict changes in financial markets, although not always with the accuracy found in nature.
The prices of many commodities reflect seasonal cycles. Due to the agricultural nature of most commodities, these cycles are easily explained and understood. However, for some securities, the cyclical nature is more difficult to explain. Theories as to why certain securities exhibit cyclical patterns range from weather and sun spots, to planetary movement and basic human psychology.
Everybody knows that prices are a consensus of human expectations. These expectations are always changing, shifting the supply/demand lines, and causing prices to oscillate between overbought and oversold levels. Fluctuations in prices are a natural process of changing expectations and lead to cyclical patterns.
Inputs:
Value - full moon date
EasyLanguage Code:
INPUT:VALUE(960305);


VALUE1 = LUNARCICLE(VALUE);


IF VALUE1 > VALUE1[1] THEN

     PLOT1(H,"FULLMOON");