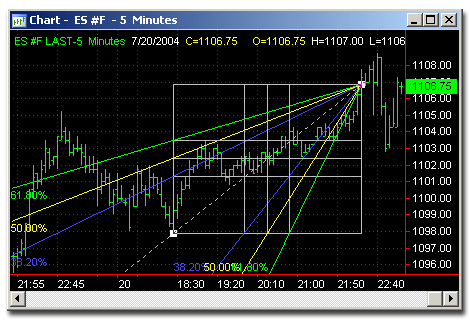
Drawing Tools can be applied, moved, and formatted, directly on a chart, providing tremendous flexibility. Many drawing tools allow you to analyze new data on a chart by extending the drawing object to the left or to the right of the chart. You can use them to call attention to any area of a chart you wish.
Description:
This tool allows for calculating support/resistance levels for an existing trend and possible retracement locations based on Fibonacci ratios.

Usage:
Speed/Resistance Fan levels help identify the support and resistance of a trend, or the price level to which a trend correction may rise or fall. In an uptrend, a downside correction usually stops at a higher speed line and, if not, prices will probably drop to the lower speedline. If that line is broken, prices will most likely continue down to the beginning of the prior trend.
In a downtrend, the breaking of a lower speedline indicates a possible rise or rally to a higher line. If a breakout occurs above that line, the rally may continue to the top of the prior trend.