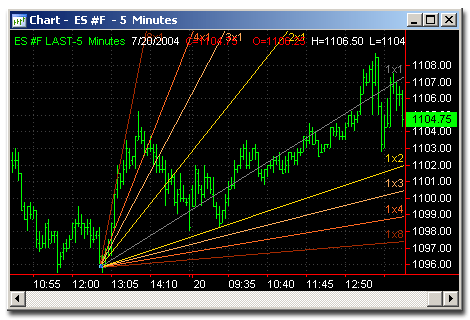
Drawing Tools can be applied, moved, and formatted, directly on a chart, providing tremendous flexibility. Many drawing tools allow you to analyze new data on a chart by extending the drawing object to the left or to the right of the chart. You can use them to call attention to any area of a chart you wish.
Description:
This is an analytical drawing tool used to identify price breakouts and the strength of those breakouts. The Gann Fan is drawn using a series of angled lines that 'fan' out from a single point.

Usage:
Gann believed that the ideal balance between time and price exists when prices rise or fall at a 45 degree angle relative to the time axis. This is also called a 1 x 1 angle (i.e., prices rise one price unit for each time unit).
Gann Angles are drawn between a significant bottom and top (or vice versa) at various angles. Deemed the most important by Gann, the 1 x 1 trendline signifies a bull market if prices are above the trendline or a bear market if below. Gann felt that a 1 x 1 trendline provides major support during an up-trend and when the trendline is broken, it signifies a major reversal in the trend. Gann identified nine significant angles, with the 1 x 1 being the most important:
1 x 8 - 82.5 degrees
1 x 4 - 75 degrees
1 x 3 - 71.25 degrees
1 x 2 - 63.75 degrees
1 x 1 - 45 degrees
2 x 1 - 26.25 degrees
3 x 1 - 18.75 degrees
4 x 1 - 15 degrees
8 x 1 - 7.5 degrees
Note that in order for the rise/run values (e.g., 1 x 1, 1 x 8, etc) to match the actual angles (in degrees), the x- and y-axes must have equally spaced intervals. This means that one unit on the x-axis (i.e., hour, day, week, month, etc) must be the same distance as one unit on the y-axis. The easiest way to calibrate the chart is make sure that a 1 x 1 angle produces a 45 degree angle.
Gann observed that each of the angles can provide support and resistance depending on the trend. For example, during an up-trend the 1 x 1 angle tends to provide major support. A major reversal is signaled when prices fall below the 1 x 1 angled trendline. According to Gann, prices should then be expected to fall to the next trendline (i.e., the 2 x 1 angle). In other words, as one angle is penetrated, expect prices to move and consolidate at the next angle.