Download: PARABOLIC.ELA
Category: Indicator > Miscellaneous
Description:
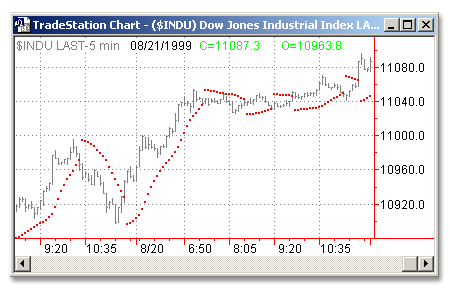
The Parabolic indicator, based on Welles Wilder's Parabolic Time/Price Strategy, is based on the relationship between a market's price and time. It is used to determine when to stop and reverse (SAR) a position utilizing time/price based stops. Once a Parabolic SAR is reached, the current position is exited and a new position in the opposite direction is taken.
Usage:
It is primarily used in trending markets and is based on always having a position in the market. The indicator may also be used to determine stop points and estimating when you would reverse a position and take a trade the opposite direction. The indicator derives its name from the fact that when charted, the pattern resembles a parabola or French curve.

Inputs:
EasyLanguage Code:
INPUTS: AF(.02);


VALUE1 = PARABOLIC(AF);


IF CURRENTBAR > 1 THEN

	PLOT1(VALUE1[1], "PARABOLIC" )

ELSE

	PLOT1(CLOSE, "PARABOLIC");


{PARABOLIC ALERT CRITERIA}

IF CLOSE CROSSES OVER PLOT1 THEN

		ALERT("PARABOLIC HAS ISSUED A BULLISH ALERT")

ELSE

	IF CLOSE CROSSES UNDER PLOT1 THEN

		ALERT("PARABOLIC HAS ISSUED A BEARISH ALERT");