Download: Stochsc.ela
File Includes:
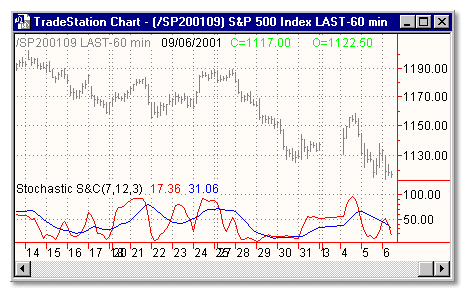
Indicator - Stochastic S&C
Function - StochasticCustom
Strategy - Stochastic S&C
Category: Indicator > Stochastic S&C
Description:
he Stochastic Oscillator compares where a security's price closed relative to its price range over a given time period. This is a smoothed version of stochastic indicator.
Usage:
There are several ways to interpret a Stochastic Oscillator.
Three popular methods include:
- Buy when the Oscillator (either %K or %D) falls below a specific level (e.g., 20) and then rises above that level. Sell when the Oscillator rises above a specific level (e.g., 80) and then falls below that level.
- Buy when the %K line rises above the %D line and sell when the %K line falls below the %D line.
- Look for divergences. For example, where prices are making a series of new highs and the Stochastic Oscillator is failing to surpass its previous highs.

Inputs:
KPeriods - length of the %K
DPeriods - length of the %D
KSlow - smoothing factor for the %K
EasyLanguage Code:
INPUT: KPERIODS(7), DPERIODS(12), KSLOW(3);

VARIABLES: KVAL(0), DVAL(0);


KVAL = STOCHASTICCUSTOM(KPERIODS, KSLOW);

DVAL = AVERAGE(KVAL, DPERIODS);


IF CURRENTBAR > KPERIODS THEN

	PLOT1(KVAL, "%K");

IF CURRENTBAR > DPERIODS THEN

	PLOT2(DVAL, "%D");