Drawing Tools can be applied, moved, and formatted, directly on a chart, providing tremendous flexibility. Many drawing tools allow you to analyze new data on a chart by extending the drawing object to the left or to the right of the chart. You can use them to call attention to any area of a chart you wish.
Description:
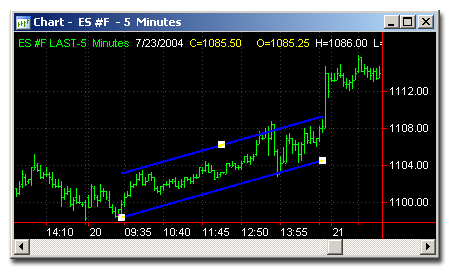
Using Equidistant Channel visualization of a climbing trend becomes simple and precise - just draw the support line, and the resistance line will be added automatically.

Usage:
Support and Resistance lines help You to understand where market goes - will it follow teh direction, reverse it or will not move at all. If price crosses either of these lines and the market continues to move in that same direction, a price breakout may have occurred.