Download: tsforecast.ELA
File Includes: Indicator - TSF (Time Series Forecast)
Category: Indicator > Predictors
Description:
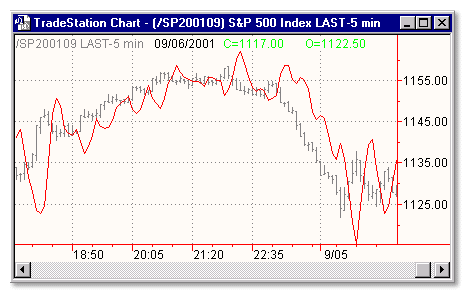
This technical indicator is based on linear regression analysis. The value of TSF for each bar is based on a regression analysis of the preceding N bars. N is called the regression period in the setup window for TSF. The user specifies a forecast period F. F is used to derive a predicted (forecasted) price value F periods in the future based on the slope of the regression line for the preceding N periods.
Usage:
This indicator is often used in trading systems in conjunction with a moving average to generate trading signals when a moving average line crosses a time series forecast line.

Inputs:
Length - number of bars to consider
BarsPlus - represents the number of bars into the future or back into the past
EasyLanguage Code:
INPUTS: LENGTH(5), BARSPLUS(7);


PLOT1(TIMESERIESFORECAST(LENGTH, BARSPLUS), "TSFORECAST");


{ALERT CRITERIA}

IF CLOSE < PLOT1 AND PLOT1 < PLOT1[1] AND PLOT1[1] > PLOT1[2] THEN

	ALERT("THE TIME SERIES FORECAST LINE HAS JUST CHANGED DIRECTION AND IS NOW BULLISH")

ELSE

	IF CLOSE > PLOT1 AND PLOT1 > PLOT1[1] AND PLOT1[1] < PLOT1[2] THEN

		ALERT("THE TIME SERIES FORECAST LINE HAS JUST CHANGED DIRECTION AND IS NOW BEARISH");


{TIME SERIES FORECAST EXPERT COMMENTARY}

#BEGINCMTRY

	COMMENTARY(EXPERTTIMESERFORCAST(PLOT1, LENGTH, BARSPLUS));

#END;