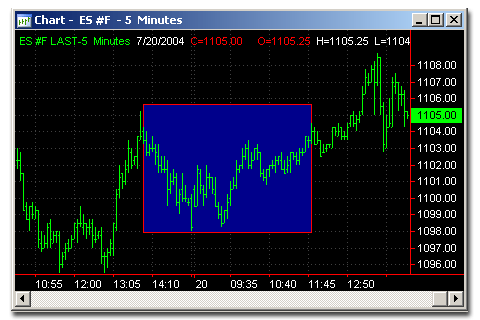
Drawing Tools can be applied, moved, and formatted, directly on a chart, providing tremendous flexibility. Many drawing tools allow you to analyze new data on a chart by extending the drawing object to the left or to the right of the chart. You can use them to call attention to any area of a chart you wish.
Description:
A Rectangle is a non-analytical drawing tool used to highlight specific portions of a chart you believe are significant. For example, you can highlight important areas for in-depth analysis and demonstration.

Usage:
Using the Rectangle You can mark out important moments on the chart. Besides using the Ellipse separately, You can use Rectangles together with analytical tools. You can use Rectangle and then use an analysis technique that identifies something important. Combining non-analytical drawing tools with analytical tools allows you to understand how good are You in identifying important market situations before using analytical techniques in your chart.