Drawing Tools can be applied, moved, and formatted, directly on a chart, providing tremendous flexibility. Many drawing tools allow you to analyze new data on a chart by extending the drawing object to the left or to the right of the chart. You can use them to call attention to any area of a chart you wish.
Description:
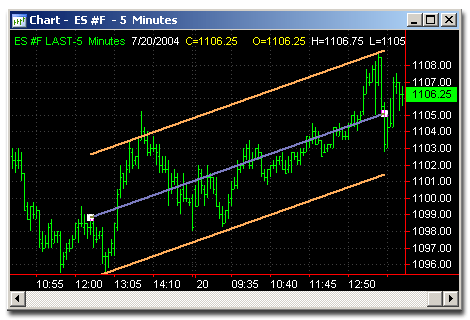
This is a channel base don the regression line, which can be calculated from Open, High, Low, Close values. The upper line is based on the maximal value for the period, the lower - on the minimal.
Usage:
The Regression Channel contains price movement with the bottom line serving as support line & the top line serving as resistance line. A common interpretation is that if prices remain outside the channel for a long period of time, then a reversal may take place.