Download: adxwithMAcombo.ela
File Includes: Indicator - ADX with MA combo
Category: Indicator > Trend Identificator
Description:
This is an original way of ADX using. First of all trader should look for price formations that demonstrate well-defined structure. By structure the author refers to price formations that exhibit, first of all, distinct cyclic periodicity, and second, incorporate natural trendlines. Natural trendlines connect only the most prominent price highs and lows of the formation under study. Once a price formation that demonstrates well-defined structure has been identified, the process of analyzing for a directional move begins. One should use ADX for this, as a measure of contraction volatility.
Usage:
The author has found is that ADX levels below 15 are synonymous with an absence of trend and a conspicuous decrease in volatility. Thus, whenever a prospective chart formation coincides with an ADX reading below 15, this situation is alerting to the market’s readiness to begin trending.
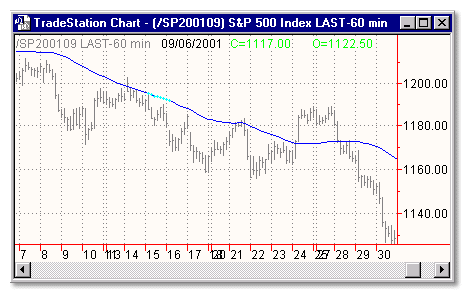
So, this indicator plots user defined moving average and marks the periods where ADX is lower than pre-defined level.

Inputs:
Price - data type to use in moving average calculation
AvgLen - number of bars to use in moving average caculation
ADXLen - number of bars to use in ADX calculation
Level - required ADX level
EasyLanguage Code:
INPUTS: PRICE(CLOSE), AVGLEN(50), ADXLEN(14), LEVEL(15);

VARS: AVGVAL(0);


AVGVAL = AVERAGE(PRICE, AVGLEN);


PLOT1(AVGVAL, "M_AVERAGE");


IF ADX(ADXLEN) < LEVEL THEN BEGIN

	PLOT2(AVGVAL, "ADX_BLW");

	IF CHECKALERT THEN ALERT = TRUE;

END;