Download: ADX.ELA
Category: Indicator > Trend Identificator
Description:
The Average Directional Movement Index (ADX) is an indicator designed to measure the strength and direction of a trend. The indicator consists of three components: the plus directional indicator (+DI), minus directional indicator (-DI) and the Average Directional indicator (ADX).
To calculate the directional movement in a trend (up or down) a range is determined by comparing today’s high and low with yesterdays close. If the largest part of today’s range is above yesterday’s range, the directional movement is plus. If the largest part of today’s range is below yesterday’s range, the directional movement is minus.
ADX(i) = [(ADX(i-1) * (n-1)) + DX(i)] / n
If today’s range is within yesterday’s range, then directional movement is zero. The ADX is calculated as the average of the directional movement indicators.
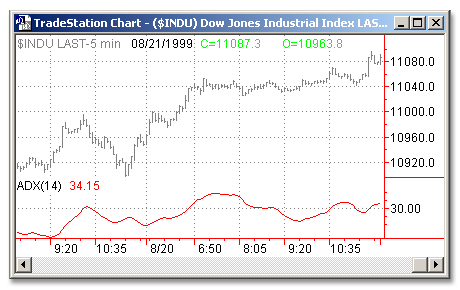
Usage:
The ADX measures the strength of a prevailing trend as well as whether movement exists in the market. A low ADX value (generally less than 20) can indicate a non-trending market with low volatility whereas a cross above 20 may signal the start of a trend (either up or down). If the ADX is over 40 and begins to fall, it can signal a slowdown of a current trend. This indicator can also be used to identify non-trending markets, or a deterioration of an ongoing trend. Although market direction is important in its calculation, the ADX is not a directional indicator.
Inputs:
Length - Number of bars of data to be included in the calculation of the ADX
EasyLanguage Code:
INPUTS: LENGTH(14);


PLOT1(ADX(LENGTH), "ADX");


{ADX ALERT CRITERIA}

IF MRO(PLOT1 < PLOT1[1], 3, 1)[1] > -1 AND PLOT1 < PLOT1[1] THEN

		ALERT("ADX HAS JUST TURNED DOWN")

ELSE

	IF MRO(PLOT1 > PLOT1[1], 3, 1)[1] > -1 AND PLOT1 > PLOT1[1] THEN

		ALERT("ADX HAS JUST TURNED UP");