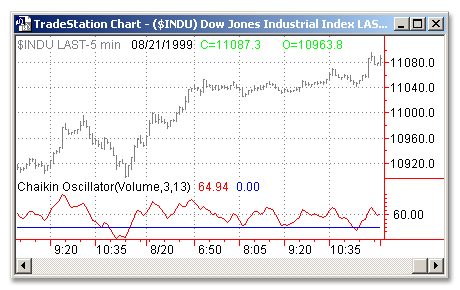
Download: CHAIKIN_OSC.ELA
Category: Indicator > Volume Based
Description:
The Chaikin Oscillator calculates and plots the difference between 2 exponential averages of the Accumulation Distribution. The Accumulation Distribution uses the relationship between the open and the close of the bar, and the range of the bar, to weight and characterize the volume as Accumulation (buying) or Distribution (selling).
The Chaikin Oscillator uses averages and differences to provide a different view of this data. Because the Chaikin Oscillator uses exponential averages, the numeric value of the Chaikin Oscillator will depend on the data available in the chart.
Usage:
The most important signal generated by the Chaikin Oscillator occurs when prices reach a new high or new low for a swing, particularly at an overbought or oversold level, and the oscillator fails to exceed its previous extreme reading and then reverses direction.
Signals in the direction of the intermediate-term trend are more reliable than those against the trend.
A confirmed high or low does not imply any further price action in that direction. I view that as a non-event.
A second way to use the Chaikin Oscillator is to view a change of direction in the oscillator as a buy or sell signal, but only in the direction of the trend. For example, if we say that a stock that is above its 90-day moving average of price is in an uptrend, then an upturn of the oscillator while in negative territory would constitute a buy signal only if the stock were above its 90-day moving average--not below it.
A downturn of the oscillator while in positive territory (above zero) would be a sell signal if the stock were below its 90-day moving average of closing prices.

Inputs:
MyVol - Volume used to calculate the Chaikin Oscillator
Fast - Number of bars of data to be included in fast exponential average
Slow - Number of bars of data to be included in slow exponential average
EasyLanguage Code:
INPUTS: MYVOL(VOLUME), FAST(3), SLOW(13);


PLOT1(CHAIKINOSC(MYVOL, FAST, SLOW) , "CHAIKIN" );

PLOT2(0 ,"ZERO");


{ALERT CRITERIA}

IF HIGH > HIGHEST(HIGH,20)[1] AND PLOT1 < HIGHEST(PLOT1,20) THEN

	ALERT("A BEARISH DIVERGENCE HAS BEEN DETECTED")

ELSE

	IF LOW < LOWEST(LOW,20)[1] AND PLOT1 > LOWEST(PLOT1,20) THEN

		ALERT("A BULLISH DIVERGENCE HAS BEEN DETECTED");