Download: float_r.ela
File Includes: Indicator - Float Analysis
Category: Indicator > Volume Based
Description:
This indicator analyses the turnover of a stock's float, based on an idea from the works of W.D. Gann, that reveals some dramatic patterns and expands the definition of a base or consolidation zone.
The floating supply of shares - or simply, float - is all of the shares actually available for trading by the public that are not owned by the company's management. This number can be incorporated into an understanding of the direct relationship between the stock price and its volume of shares traded. This is easily seen when a backward cumulative count of the volume is studied in relation to a stock's floating supply of shares.
Usage:
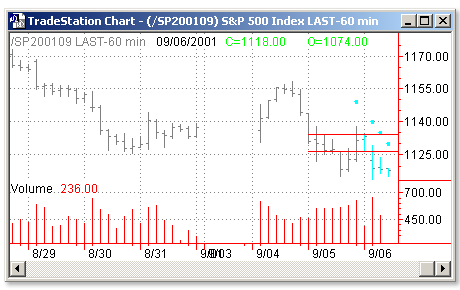
The float is a variable input value that must be entered for each different stock under consideration. Starting on any given day and working backward, the current day’s volume is added to the previous day’s volume and adds that to the next previous day’s volume and so on. As each volume number from the past is added cumulatively, the computer compares the running total with that particular stock’s float. When the cumulative total is equal to or greater than the float, a dot is placed above that particular bar on the chart.
Then two horizontal lines are plotted on the chart. The top line shows the highest price reached during the backward count, and the bottom line, the lowest price. These lines serve as trigger lines for the buy and sell signals. When the stock’s price goes through the top line it gives a buy signal, and when it goes through the bottom line it gives a sell signal. The lines extend backward from the starting date to the bar, where the float has gone through one complete turnover.

Inputs:
FLOATVAL - Is the float value, number of shares currently available for trading
STRTDATE - Is the date at which to start the accummulation of the volume. If STRTDATE is zero, then the accummulation will begin in the LastCalcDate
EXTRGT - determines if the horizontal lines drawn by the indicator will extend to the right, or if they will terminate at the STRTDATE
EasyLanguage Code:
INPUTS: FLOATVAL(365000000), STRTDATE(0), EXTRGT("TRUE");

VARS: VOLCALC(0), BARCOUNT(0), HICALC(0), LOCALC(0), TL1(0), TL2(0), TXT1(0), FAILURE(FALSE);


IF DATE = STRTDATE OR (DATE = LASTCALCDATE AND STRTDATE = 0) THEN BEGIN

	BARCOUNT = 0;

	FAILURE = FALSE;

	PLOT2(HIGH, "STRTDATE");

	PLOT3(LOW, "STRTDATE");

	WHILE VOLCALC < FLOATVAL AND FAILURE = FALSE BEGIN

		IF BARCOUNT > MAXBARSBACK THEN BEGIN

			FAILURE = TRUE;

			VOLCALC = VOLUME[BARCOUNT+10];

		END;

		VOLCALC = VOLCALC + VOLUME[BARCOUNT];

		BARCOUNT = BARCOUNT + 1;

	END;

	HICALC = HIGHEST(H, BARCOUNT-1);

	LOCALC = LOWEST(L, BARCOUNT-1);


	PLOT1[BARCOUNT](HIGH[BARCOUNT]*1.01, "FLOAT");

	IF STRTDATE <> 0 THEN BEGIN

		TL1 = TL_NEW(STRTDATE, TIME, HICALC, DATE[BARCOUNT], TIME, HICALC);

		TL2 = TL_NEW(STRTDATE, TIME, LOCALC, DATE[BARCOUNT], TIME, LOCALC);

	END ELSE BEGIN

		TL1 = TL_NEW(LASTCALCDATE, TIME, HICALC, DATE[BARCOUNT], TIME, HICALC);

		TL2 = TL_NEW(LASTCALCDATE, TIME, LOCALC, DATE[BARCOUNT], TIME, LOCALC);

	END;


	IF UPPERSTR(EXTRGT) = "TRUE" OR   UPPERSTR(EXTRGT) = "T" THEN BEGIN

		TL_SETEXTRIGHT(TL1, TRUE);

		TL_SETEXTRIGHT(TL2, TRUE);

	END;

	TL_SETEXTLEFT(TL1, FALSE);

	TL_SETEXTLEFT(TL2, FALSE);

END;


IF DATE > STRTDATE AND STRTDATE <> 0 THEN BEGIN

	IF LOW CROSSES ABOVE TL_GETENDVAL(TL1) AND CHECKALERT THEN

		ALERT = TRUE;

	IF HIGH CROSSES BELOW TL_GETENDVAL(TL2) AND CHECKALERT THEN

		ALERT = TRUE;

END;