Hollow Candlestick Chart: Difference between revisions
No edit summary |
No edit summary |
||
| (12 intermediate revisions by one other user not shown) | |||
| Line 1: | Line 1: | ||
Hollow candles are a useful tool to monitor and analyze price movements.<br> | Hollow candles are a useful tool to monitor and analyze price movements.<br> | ||
A Hollow Candlestick | A Hollow Candlestick chart plots data series using a sequence of candlestick figures. A single candlestick consists of a body and a wick (also known as shadow or tail). The entire length of the candlestick represents the distance from the high to the low. | ||
The body represents the distance between the open price and the close price. | The body represents the distance between the open price and the close price. | ||
| Line 9: | Line 8: | ||
On the chart, the body of a candlestick takes the form of a pillar-like rectangle. The wick is the line above and/or below the body. | On the chart, the body of a candlestick takes the form of a pillar-like rectangle. The wick is the line above and/or below the body. | ||
The body of a candlestick can be either hollow or solid. | <img src="https://www.multicharts.com/trading-software/images/d/d9/CS_HCandlestick.png" width="400"> | ||
<br>The body of a candlestick can be either hollow or solid. | |||
{| class="wikitable" | {| class="wikitable" | ||
| Line 35: | Line 36: | ||
<br> | <br> | ||
== Selecting Hollow Candlestick Chart Type == | == Selecting Hollow Candlestick Chart Type == | ||
Chart type can be selected from the '''Format Instruments''' window: | Chart type can be selected from the '''Format Instruments''' window: | ||
| Line 47: | Line 48: | ||
<br> | <br> | ||
== Selecting Hollow Candlestick Chart Style == | == Selecting Hollow Candlestick Chart Style == | ||
Chart style can be set from the '''Format Instruments''' window: | Chart style can be set from the '''Format Instruments''' window: | ||
| Line 61: | Line 62: | ||
<br> | <br> | ||
== Candlestick Charts VS Hollow Candlestick Charts == | |||
Regular and hollow candlesticks are two types of candlestick charts used in technical analysis to visualize price movements in financial markets.<br> | |||
Compared to regular ones, hollow candles provide a different perspective on price movement and can give a more accurate and clear visualisation of market trends.<br> | |||
While regular candles are only based on price movement within a set time period, hollow candles also take into account a previous time period, giving traders an additional layer of information. | |||
=== How to Interpret Candles === | |||
{| class="wikitable" | |||
|<p align="center"></p> | |||
|<p align="center">'''Regular candles'''</p> | |||
|<p align="center"> '''Hollow candles'''</p> | |||
|- | |||
|<p align="center">'''Hollow'''</p> | |||
|rowspan="2"|<p align="center">Always solid | |||
</p><!--Regular candles--> | |||
|<p align="center">Current Close is higher than current Open | |||
|- | |||
|<p align="center">'''Solid'''</p> | |||
|<p align="center">Current Close is lower than current Open | |||
|- | |||
|<p align="center"><font color="red">'''Red'''</p> | |||
|<p align="center">Current Close is <font color="red">lower</font> than '''current''' Open</p><!----> | |||
|<p align="center">Current Close is <font color="red">lower</font> than '''previous''' Close</p><!----> | |||
|- | |||
|<p align="center"><font color="green">'''Green'''</p> | |||
|<p align="center">Current Close is <font color="green">higher</font> than '''current''' Open</p><!----> | |||
|<p align="center">Current Close is <font color="green">higher</font> than '''previous''' Close</p><!----> | |||
|- | |||
|} | |||
For more info about regular candles see the '''[[Candlestick Chart]]''' page. | |||
[[Category:Chart Style]] | [[Category:Chart Style]] | ||
Latest revision as of 13:14, 31 May 2024
Hollow candles are a useful tool to monitor and analyze price movements.
A Hollow Candlestick chart plots data series using a sequence of candlestick figures. A single candlestick consists of a body and a wick (also known as shadow or tail). The entire length of the candlestick represents the distance from the high to the low.
The body represents the distance between the open price and the close price.
The wick can be on either end or both ends. A wick above the body represents the distance from the high to the open/close, whichever is closer. A wick below the body represents the distance from the low to the open/close, whichever is closer.
On the chart, the body of a candlestick takes the form of a pillar-like rectangle. The wick is the line above and/or below the body.
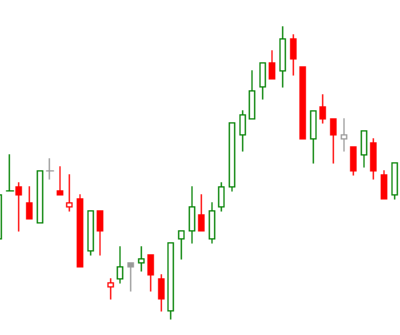
The body of a candlestick can be either hollow or solid.
| Hollow | A candlestick with a hollow body is called a bullish candlestick. The close is higher than the open. |
| Solid | A candlestick with a solid body is called a bearish candlestick. The close is lower than the open. |
Additionally, a candlestick can be one of three colors.
| Green (Up) | The close of the current candlestick is higher than the close of the previous candlestick. |
| Grey (Neutral) | The close of the current candlestick is the same as the close of the previous candlestick. |
| Red (Down) | The close of the current candlestick is lower than the close of the previous candlestick. |
To change the colors,
- Double-click on the data series in the chart.
- Select the Style tab.
- Select Hollow Candlestick under Chart Type.
- Click the color bars under Chart Style to select different colors.
Selecting Hollow Candlestick Chart Type
Chart type can be selected from the Format Instruments window:
- Open the Format Instruments window.To open the Format Instruments window, click the Format Instruments
 icon on the main toolbar;
if the Format Objects window appears, select the symbol and click the Format button.
The Format Instruments window can also be opened by one of the following methods:
- Position the mouse pointer over the symbol's data series; double-click once the Pointer changes into a Hand
  ;
;
- Position the mouse pointer over the symbol's data series; once the Pointer changes into a Hand right-click and then click Format Symbol Name;
- Right-click on an empty area of the chart and then click Format Instruments; if the Format Objects window appears, select the symbol and click the Format button;
- Select Format in the main menu and click Instrument; if the Format Objects window appears, select the symbol and click the Format button. - Select the Style tab.
- In the Chart Type list box select Hollow Candlestick.
Hollow Candlestick Chart Type can also be selected if you click the Hollow Candlestick Chart ![]() icon on the Chart Analysis toolbar.
icon on the Chart Analysis toolbar.
Selecting Hollow Candlestick Chart Style
Chart style can be set from the Format Instruments window:
- Open the Format Instruments window.To open the Format Instruments window, click the Format Instruments icon on the main toolbar;
if the Format Objects window appears, select the symbol and click the Format button.
The Format Instruments window can also be opened by one of the following methods:
- Position the mouse pointer over the symbol's data series; double-click once the Pointer changes into a Hand ;
- Position the mouse pointer over the symbol's data series; once the Pointer changes into a Hand right-click and then click Format Symbol Name;
- Right-click on an empty area of the chart and then click Format Instruments; if the Format Objects window appears, select the symbol and click the Format button;
- Select Format in the main menu and click Instrument; if the Format Objects window appears, select the symbol and click the Format button. - Select the Style tab.
- In the Chart Style section click on the component element to be changed.
- In the Color column select one of the standard 40 colors from the palette box, or click the Other button to create custom colors.
- From the Width drop-down list box select a width to change the thickness of the candlestick.
- To apply the most recently selected component's style to all components, click the Apply to All Components button.
- To display the Last Price Marker select the Last Price Marker check box, or clear the box to hide the marker; the color of the marker is the same as the color of the Down component.
- To use these style settings for all new charts of this type, select Use as Default check box.
Candlestick Charts VS Hollow Candlestick Charts
Regular and hollow candlesticks are two types of candlestick charts used in technical analysis to visualize price movements in financial markets.
Compared to regular ones, hollow candles provide a different perspective on price movement and can give a more accurate and clear visualisation of market trends.
While regular candles are only based on price movement within a set time period, hollow candles also take into account a previous time period, giving traders an additional layer of information.
How to Interpret Candles
Regular candles |
Hollow candles | |
Hollow |
Always solid |
Current Close is higher than current Open |
Solid |
Current Close is lower than current Open | |
Red |
Current Close is lower than current Open |
Current Close is lower than previous Close |
Green |
Current Close is higher than current Open |
Current Close is higher than previous Close |
For more info about regular candles see the Candlestick Chart page.