
MultiCharts 8.5 Beta 1 features all-new Volume Delta and Cumulative Delta chart types, Volume Profile built from the ground up, TimePriceOpportunity built-in indicator and increased overall stability and performance. New flexible commission rules allow setting virtually any commission structure for accurate backtesting. Order and Position tracker has two new tabs – “Alerts” and “Market Position History at Broker”.
Make sure you ask our support if you have any questions.
Read more...
How to Migrate from MultiCharts 32 bit to MultiCharts 64 bit
https://www.multicharts.com/trading-sof ... rts_64_bit
MULTICHARTS 8.5 BETA 1 – WHAT’S NEW
-
arnie

- Posts: 1594
- Joined: 11 Feb 2009
- Location: Portugal
- Has thanked: 481 times
- Been thanked: 514 times
Re: MULTICHARTS 8.5 BETA 1 – WHAT’S NEW
Here are some examples:
- Attachments
-
- ex_03.png
- (57.33 KiB) Downloaded 21672 times
-
- ex_02.png
- (45 KiB) Downloaded 21317 times
-
- ex_01.png
- (49.8 KiB) Downloaded 21509 times
Re: MULTICHARTS 8.5 BETA 1 – WHAT’S NEW
This does look awesome and like a huge step forward for Multicharts. No need to run (2) different charting platforms at the same time now, let alone pay for (2).
so..cool beans
http://www.youtube.com/watch?v=vc7VBVpl1SY
so..cool beans
http://www.youtube.com/watch?v=vc7VBVpl1SY
Re: MULTICHARTS 8.5 BETA 1 – WHAT’S NEW
Hi guys, thanks for the update!
Can you please let me know if it is possible to access bid/ask volume from Easylanguage. I use IQ-Feed.
Regards, Manuel
Can you please let me know if it is possible to access bid/ask volume from Easylanguage. I use IQ-Feed.
Regards, Manuel
Last edited by UTrader on 17 Nov 2012, edited 1 time in total.
Re: MULTICHARTS 8.5 BETA 1 – WHAT’S NEW
Thanks for a great release it is a major enhancement.
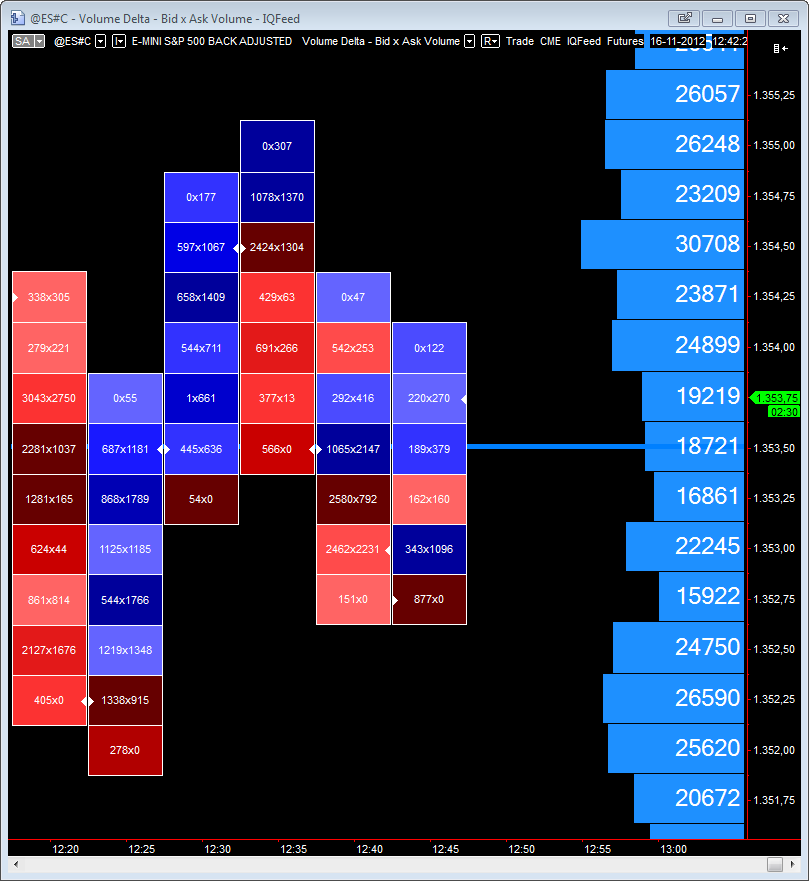
Scaling is of the volume bars is something I haven't been able to sort out yet, it would appear that the size of the volume blocks is only relative to the bar.
This can give very different size blocks for similar volume in different bars.
Looking at the attachment notice the very low cell is 3* larger than the high price cell despite being only 30% greater, it would be good to be able to set the scale to be consistent across the bars on the screen or set a fixed scale.
- Attachments
-
- volume profile.png
- (97.52 KiB) Downloaded 17991 times
Last edited by jl12 on 17 Nov 2012, edited 5 times in total.
Re: MULTICHARTS 8.5 BETA 1 – WHAT’S NEW
Arnie would you mind giving the settings for your first SP example
I haven't been able to replicate the uniform cells with the bid ask values.
I haven't been able to replicate the uniform cells with the bid ask values.
-
arnie
- Posts: 1594
- Joined: 11 Feb 2009
- Location: Portugal
- Has thanked: 481 times
- Been thanked: 514 times
Re: MULTICHARTS 8.5 BETA 1 – WHAT’S NEW
This?
- Attachments
-
- foot_set.png
- (34.23 KiB) Downloaded 21423 times
Re: MULTICHARTS 8.5 BETA 1 – WHAT’S NEW
I am interested in the following new feature:
Please advise.
However, I do not see where in the Broker Profile I can change the timeoout setting. There isn't anything for this in the Interactive Brokers properties settings.Timeout can now be specified manually in the broker profile for Interactive Brokers. This helps if you get the following message from IB: “Didn’t receive final status for the order”, and you’d like to increase the waiting time.
Please advise.
-
CrazyNasdaq

- Posts: 322
- Joined: 02 Sep 2009
- Location: ITALY
- Has thanked: 98 times
- Been thanked: 90 times
Re: MULTICHARTS 8.5 BETA 1 – WHAT’S NEW
I can't find text on Volume delta chart. It plots correctly the candle with colored cells, but no text in the cells.
- Attachments
-
- Volume Delta.png
- (107.02 KiB) Downloaded 17891 times
-
CrazyNasdaq
- Posts: 322
- Joined: 02 Sep 2009
- Location: ITALY
- Has thanked: 98 times
- Been thanked: 90 times
Re: MULTICHARTS 8.5 BETA 1 – WHAT’S NEW
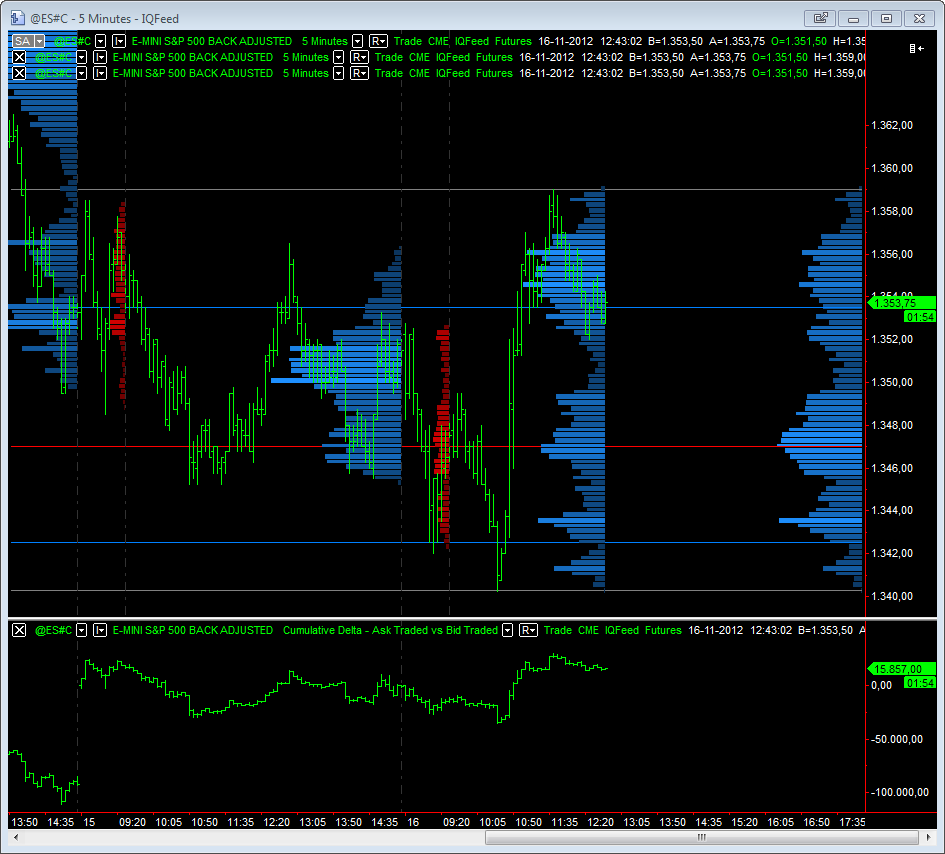
Please, add in the cumulative Delta Chart the Chart Type "line on close" to plot the Cumulative Delta over the price with the price scale on the left side as shown in the picture. Only candlestick make this type of chart not useful to overplot price with Cumulative Delta.
Thanks
Thanks
- Attachments
-
- Cumulative Delta.png
- (145.01 KiB) Downloaded 18002 times
-
arnie
- Posts: 1594
- Joined: 11 Feb 2009
- Location: Portugal
- Has thanked: 481 times
- Been thanked: 514 times
Re: MULTICHARTS 8.5 BETA 1 – WHAT’S NEW
You need to expand the bars or zoom in. Text is not visible when the bars are too small to handle it.I can't find text on Volume delta chart. It plots correctly the candle with colored cells, but no text in the cells.
-
arnie
- Posts: 1594
- Joined: 11 Feb 2009
- Location: Portugal
- Has thanked: 481 times
- Been thanked: 514 times
Re: MULTICHARTS 8.5 BETA 1 – WHAT’S NEW
Have you tried the datafeed or broker settings on Quote Manager?I am interested in the following new feature:
However, I do not see where in the Broker Profile I can change the timeoout setting. There isn't anything for this in the Interactive Brokers properties settings.Timeout can now be specified manually in the broker profile for Interactive Brokers. This helps if you get the following message from IB: “Didn’t receive final status for the order”, and you’d like to increase the waiting time.
Please advise.
-
CrazyNasdaq
- Posts: 322
- Joined: 02 Sep 2009
- Location: ITALY
- Has thanked: 98 times
- Been thanked: 90 times
Re: MULTICHARTS 8.5 BETA 1 – WHAT’S NEW
I've expanded the bars to very large and the text appeared. Now my observation is......it would be much useful if the user could choose the text dimension because with this static resolution of the text, you can observe only few candle of Bid x Ask and the same thing is for text on Volume profile where you can really watch the text relative to Volume or Delta or Bid x Ask only if you expand the picture to a very huge detailed resolution (see the picture attached).You need to expand the bars or zoom in. Text is not visible when the bars are too small to handle it.I can't find text on Volume delta chart. It plots correctly the candle with colored cells, but no text in the cells.
Thanks anyway for the suggestion arnie.
- Attachments
-
- Bid x Ask Delta.png
- (99.14 KiB) Downloaded 18061 times

Re: MULTICHARTS 8.5 BETA 1 – WHAT’S NEW
Hello community,
I have installed MC 8.5 beta 1 32-bit and using IB-data.
I use a 1-minute Candlestick chart based on Trade-data.
When I change to Heikn-Ashi with the same settings the Quotemanager starts to request for Tick-ask and Tick-bid.
So I get a lot of "Historical data request pacing violation" from IB and have to wait a long time until the chart is build.
I tested this with different instruments - it is all the same.
With MC 8.0 this didnot happen.
aiti
-
arnie
- Posts: 1594
- Joined: 11 Feb 2009
- Location: Portugal
- Has thanked: 481 times
- Been thanked: 514 times
Re: MULTICHARTS 8.5 BETA 1 – WHAT’S NEW
I understand your point and I share your pain.I've expanded the bars to very large and the text appeared. Now my observation is......it would be much useful if the user could choose the text dimension because with this static resolution of the text, you can observe only few candle of Bid x Ask and the same thing is for text on Volume profile where you can really watch the text relative to Volume or Delta or Bid x Ask only if you expand the picture to a very huge detailed resolution (see the picture attached).You need to expand the bars or zoom in. Text is not visible when the bars are too small to handle it.I can't find text on Volume delta chart. It plots correctly the candle with colored cells, but no text in the cells.
Thanks anyway for the suggestion arnie.
The text is actually dynamic and not static in the sense that it automatically re-sizes on the bar size. When the bar becomes too small, the text will also become smaller to a point where you cannot read it, so it stops being plotted, you can only see the bars.
Personally I also would like to see the text even when we zoom out the chart but there's a limit to it, right? How good are your eyes reading really small text?
In the attached images I show 2 examples, on the first image you cannot see the text and on the second, after expanding the price scale just a little bit, the letters are plotted. You really need to have good eyes to stay hours and hours looking at such small text.
Yes, they could be a little bigger than that, but not that much because otherwise they would fall on top of the price above and below.
In this case, the bigger the screen, the bigger the chart, the bigger the text. So, no monitors lower than 21" if you want to be able to have as much bars as possible with a readable (ie. comfortable) size.
By the way, on the volume profile settings, over Display Text, you're able to change its size, for example, if you zoom in the chart, the text for the profile sometimes becomes to big, you're able to go lower on its size.
PS: for the forum developers, you guys should find a better way to plot the images in here. You should adopt the way Mike did on BMT where, when the images are embeded, they are showed with a default size, as a preview. This way we would not deform the thread page when plotting big images.
- Attachments
-
- delta_bars02.png
- (102.21 KiB) Downloaded 17886 times
-
- delta_bars01.png
- (20.2 KiB) Downloaded 17932 times
-
arnie
- Posts: 1594
- Joined: 11 Feb 2009
- Location: Portugal
- Has thanked: 481 times
- Been thanked: 514 times
Re: MULTICHARTS 8.5 BETA 1 – WHAT’S NEW
There's seems to be a bug here:
I selected a color as Custom Color...
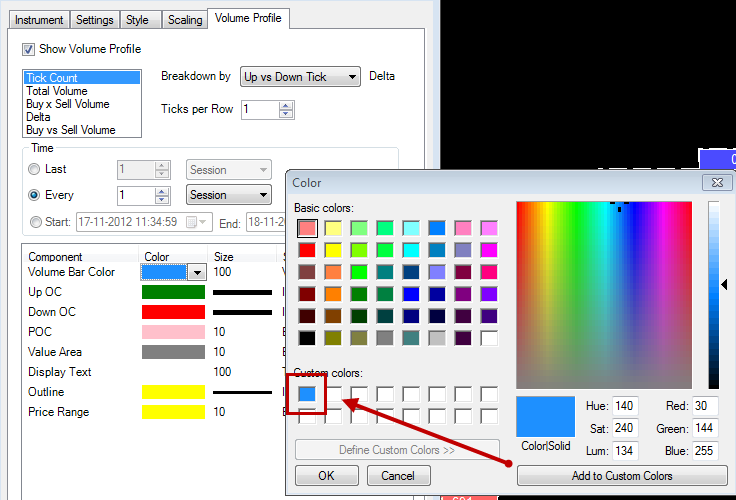
...but when I go back to use that same color on another component there's none.
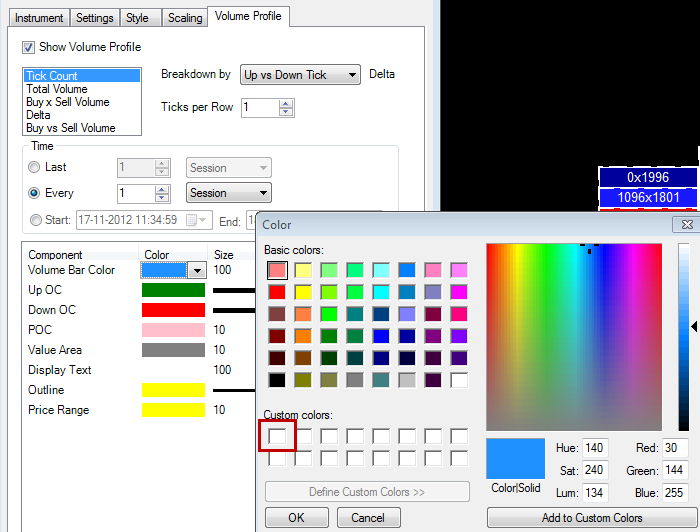
I selected a color as Custom Color...
...but when I go back to use that same color on another component there's none.
- Attachments
-
- custom_02.png
- (41.89 KiB) Downloaded 21322 times
-
- custom_01.png
- (44.12 KiB) Downloaded 21165 times
Re: MULTICHARTS 8.5 BETA 1 – WHAT’S NEW
Anyone else experience a crash soon after upgrading which produced the attached error message? It happened for me on two separate computers.
- Attachments
-
- errorNov18.PNG
- (12.25 KiB) Downloaded 17832 times
Re: MULTICHARTS 8.5 BETA 1 – WHAT’S NEW
I too have found the text issue frustrating, apart from text filling not filling the cell it should be possible to truncate values for high volume contracts.
2 digits would generally suffice.
To see more data I have had to remove any thing other than text.
see attachment 2,
however there is still a lot of empty screen.
These types of issues seem to have been handled quite well by the Gomi+ ztb volume ladder addons in BMT for NT.
Toggling between views would is also a nice feature.
- Attachments
-
- vol1.png
- (140.41 KiB) Downloaded 17974 times
-
- volprof2.png
- (106.76 KiB) Downloaded 17884 times
Re: MULTICHARTS 8.5 BETA 1 – WHAT’S NEW
I have found an issue when performing backtests / optimization and the primary instrument has the quote field set to Ask or Bid the back-testing results are empty.
If I have the quote field of the primary instrument set to Trade then I get some results back. This means I cannot run backtests with bar magnifier on.
If I have the quote field of the primary instrument set to Trade then I get some results back. This means I cannot run backtests with bar magnifier on.
-
LRP

- Posts: 153
- Joined: 07 Apr 2008
- Location: Switzerland
- Has thanked: 96 times
- Been thanked: 15 times
Re: MULTICHARTS 8.5 BETA 1 – WHAT’S NEW
Crash and freeze always at start! Please see Pic. Any ideas?
- Attachments
-
- FreezeOnMC8.5Beta1.JPG
- (46.52 KiB) Downloaded 18048 times
-
CrazyNasdaq
- Posts: 322
- Joined: 02 Sep 2009
- Location: ITALY
- Has thanked: 98 times
- Been thanked: 90 times
Re: MULTICHARTS 8.5 BETA 1 – WHAT’S NEW
How do you reproduce the setting to have picture #2 (volprof2.png) ?I too have found the text issue frustrating, apart from text filling not filling the cell it should be possible to truncate values for high volume contracts.
2 digits would generally suffice.
To see more data I have had to remove any thing other than text.
see attachment 2,
however there is still a lot of empty screen.
These types of issues seem to have been handled quite well by the Gomi+ ztb volume ladder addons in BMT for NT.
Toggling between views would is also a nice feature.
For Bid x Ask I can only choose "Volume Delta" and it plots cells not bars.
-
arnie
- Posts: 1594
- Joined: 11 Feb 2009
- Location: Portugal
- Has thanked: 481 times
- Been thanked: 514 times
Re: MULTICHARTS 8.5 BETA 1 – WHAT’S NEW
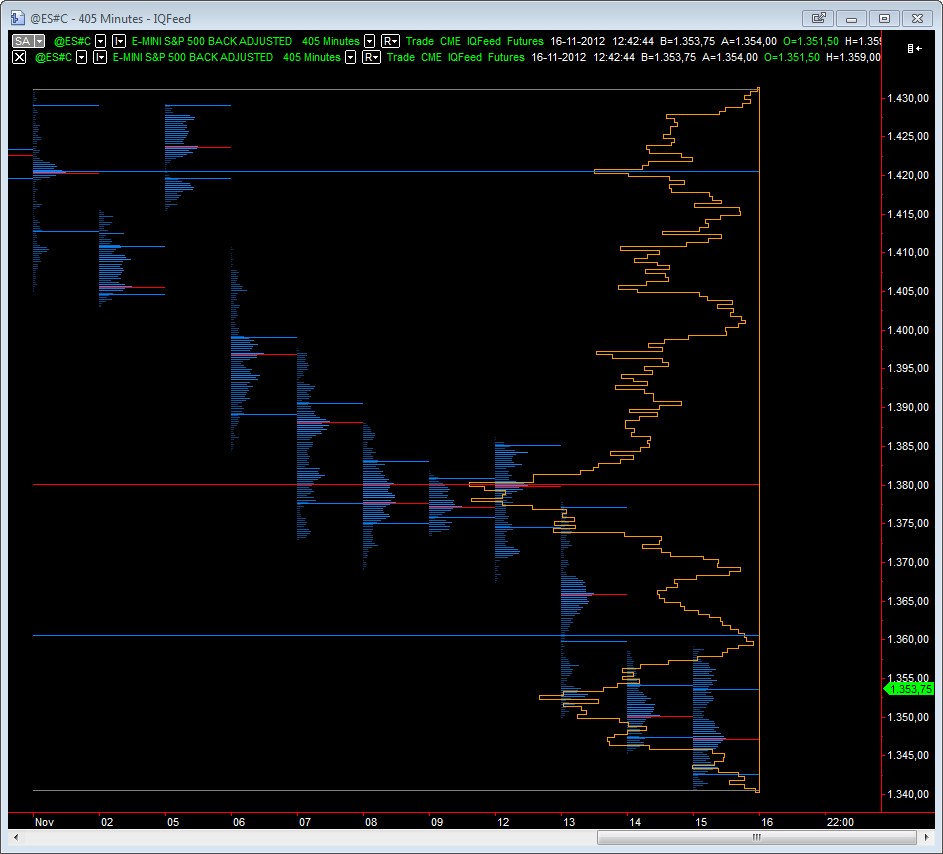
I'd like to request Support to facilitate us a "workable" workspace with the TPO indicador applied to an ES chart, using IQFeed. I just can't seem to find the correct settings for this. Pretty stressful...
Thanks.
Thanks.
Re: MULTICHARTS 8.5 BETA 1 – WHAT’S NEW
CrazyNasdaqHow do you reproduce the setting to have picture #2 (volprof2.png) ?
For Bid x Ask I can only choose "Volume Delta" and it plots cells not bars.
The settings are attached.
Make sure the chart type is set to regular.
-
TJ

- Posts: 7752
- Joined: 29 Aug 2006
- Location: Global Citizen
- Has thanked: 1034 times
- Been thanked: 2228 times
Re: MULTICHARTS 8.5 BETA 1 – WHAT’S NEW
please post a screen shot and chart settings.Lovely promise here. But I'm getting gibberish for cumulative delta bidxask...just an upward sloping line...Anyone else have this issue?
-
arnie
- Posts: 1594
- Joined: 11 Feb 2009
- Location: Portugal
- Has thanked: 481 times
- Been thanked: 514 times
Re: MULTICHARTS 8.5 BETA 1 – WHAT’S NEW
You do not have enough data, that's why you have those bars.Here y'go!
Cumulative Delta takes its data from the Volume Delta bars.
Open a Volume Delta bar chart and download Ask traded vs Bid traded data. After you have this data you then can open a Cumulative Delta bar chart.
You should be OK now.
Re: MULTICHARTS 8.5 BETA 1 – WHAT’S NEW
Great work, thanks to the whole MC team.
Is there a way to change the color of the numbers at Volume Delta charts from white to another color (ie. black) without changing the Wick color to black?
Is there a way to change the color of the numbers at Volume Delta charts from white to another color (ie. black) without changing the Wick color to black?
-
CrazyNasdaq
- Posts: 322
- Joined: 02 Sep 2009
- Location: ITALY
- Has thanked: 98 times
- Been thanked: 90 times
Re: MULTICHARTS 8.5 BETA 1 – WHAT’S NEW
Cumulative Delta needs a good quality feed to work properly. You must have a correct synchronization of Bid- Ask-Trade to have a correct Cumulative Delta indicator. You can find in the forum many topic regard this aspect.Thanks. I do have 180 days of data loaded. Could it be the data provider? I'm using TS...
Probably TS data doesn't match this criteria and doesn't have good bid-asK-trade synchronization, so the chart that you plot with TS data is not good.
The best feed at the moment for this analysis is IQFeed
If you pay attention, all the charts that have been posted in this post since now are made with IQFeed data.
Hope this will help you
-
arnie
- Posts: 1594
- Joined: 11 Feb 2009
- Location: Portugal
- Has thanked: 481 times
- Been thanked: 514 times
Re: MULTICHARTS 8.5 BETA 1 – WHAT’S NEW
Great work, thanks to the whole MC team.
Is there a way to change the color of the numbers at Volume Delta charts from white to another color (ie. black) without changing the Wick color to black?
At the moment no but I believe it will be available in one of the next beta versions
-
Dave Masalov

- Posts: 1712
- Joined: 16 Apr 2010
- Has thanked: 51 times
- Been thanked: 489 times
Re: MULTICHARTS 8.5 BETA 1 – WHAT’S NEW
Hello jl12,Thanks for a great release it is a major enhancement.
Scaling is of the volume bars is something I haven't been able to sort out yet, it would appear that the size of the volume blocks is only relative to the bar.
This can give very different size blocks for similar volume in different bars.
Looking at the attachment notice the very low cell is 3* larger than the high price cell despite being only 30% greater, it would be good to be able to set the scale to be consistent across the bars on the screen or set a fixed scale.
Volume blocks are scaled within a bar. Please post a screenshot of the chart in any trading platform to demonstrate the feature you request.
-
arnie
- Posts: 1594
- Joined: 11 Feb 2009
- Location: Portugal
- Has thanked: 481 times
- Been thanked: 514 times
Re: MULTICHARTS 8.5 BETA 1 – WHAT’S NEW
Possible bug?
Never noticed this before.
I already had my charts opened, RTH only.
The market opened (treasuries), Volume Delta bars initiated correctly but volume profile did not. Although having the Last Session option on, it continued to show Fridays session. Only after changing the bars the profile reset and start to show the correct session.
It will be interesting if this happens again in 30 minutes time when the ES opens.
- Attachments
-
- sess_start03.png
- (84.09 KiB) Downloaded 17888 times
-
- sess_start02.png
- (297.64 KiB) Downloaded 17872 times
-
- sess_start01.png
- (286.34 KiB) Downloaded 17818 times
-
arnie
- Posts: 1594
- Joined: 11 Feb 2009
- Location: Portugal
- Has thanked: 481 times
- Been thanked: 514 times
Re: MULTICHARTS 8.5 BETA 1 – WHAT’S NEW
There's definitely a problem here.
Another chart (RTH) that I had opened prior the market open and the profile cannot be seen.
After changing the bar periodicity the profile became visible.
Another chart (RTH) that I had opened prior the market open and the profile cannot be seen.
After changing the bar periodicity the profile became visible.
- Attachments
-
- sess_start05.png
- (28.92 KiB) Downloaded 17974 times
-
- sess_start04.png
- (66.87 KiB) Downloaded 17899 times
-
Dave Masalov
- Posts: 1712
- Joined: 16 Apr 2010
- Has thanked: 51 times
- Been thanked: 489 times
Re: MULTICHARTS 8.5 BETA 1 – WHAT’S NEW
TO_Trader,I am interested in the following new feature:
However, I do not see where in the Broker Profile I can change the timeoout setting. There isn't anything for this in the Interactive Brokers properties settings.Timeout can now be specified manually in the broker profile for Interactive Brokers. This helps if you get the following message from IB: “Didn’t receive final status for the order”, and you’d like to increase the waiting time.
Please advise.
Timeout setting can be changed in the registry. Go to Start -> Run, type regedit and press Enter.
Then, find the following key in the registry editor:
HKEY_CURRENT_USER\Software\TS Support\MultiCharts\TraderServer\AT_WaitOrdersTimeOut
Default setting is 60 seconds. This timeout affects only auto trading orders sent to all brokers.
-
Dave Masalov
- Posts: 1712
- Joined: 16 Apr 2010
- Has thanked: 51 times
- Been thanked: 489 times
Re: MULTICHARTS 8.5 BETA 1 – WHAT’S NEW
CrazyNasdaq,Please, add in the cumulative Delta Chart the Chart Type "line on close" to plot the Cumulative Delta over the price with the price scale on the left side as shown in the picture. Only candlestick make this type of chart not useful to overplot price with Cumulative Delta.
Thanks
Thank you for your suggestion. It has been forwarded to the developers and will be cosidered for future implementation.
-
Dave Masalov
- Posts: 1712
- Joined: 16 Apr 2010
- Has thanked: 51 times
- Been thanked: 489 times
Re: MULTICHARTS 8.5 BETA 1 – WHAT’S NEW
Manuel,Hi guys, thanks for the update!
Can you please let me know if it is possible to access bid/ask volume from Easylanguage. I use IQ-Feed.
Regards, Manuel
Unfortunately, there is no way to get bid/ask volume from IQFeed. You can get bid/ask volume DOM data using Dom_asksize and Dom_bidsize keywords if your broker provides DOM data.
https://www.multicharts.com/trading-sof ... om_asksize
https://www.multicharts.com/trading-sof ... om_bidsize
Re: MULTICHARTS 8.5 BETA 1 – WHAT’S NEW
Dave, here are the 2 screen shots of the Es with Fixed scaling of 8000 the other with Maximum of bar.
Note how using Maximum of bar can result in volume spikes being missed.
A third method- scaling to maximum value on screen might be useful alternative.
Note how using Maximum of bar can result in volume spikes being missed.
A third method- scaling to maximum value on screen might be useful alternative.
- Attachments
-
- MAXOFBARpng.png
- (124.56 KiB) Downloaded 17822 times
-
- FIXEDDELTASCALE.png
- (131.28 KiB) Downloaded 17879 times
-
Dave Masalov
- Posts: 1712
- Joined: 16 Apr 2010
- Has thanked: 51 times
- Been thanked: 489 times
Re: MULTICHARTS 8.5 BETA 1 – WHAT’S NEW
aiti,Hello community,
I have installed MC 8.5 beta 1 32-bit and using IB-data.
I use a 1-minute Candlestick chart based on Trade-data.
When I change to Heikn-Ashi with the same settings the Quotemanager starts to request for Tick-ask and Tick-bid.
So I get a lot of "Historical data request pacing violation" from IB and have to wait a long time until the chart is build.
I tested this with different instruments - it is all the same.
With MC 8.0 this didnot happen.
aiti
Do you have the "Show Volume Profile" check box checked in Format Instrument -> Voulme Profile? If yes, and "Breakdown by" is set to "Ask vs Bid Traded", then it is normal that MC requests ask and bid tick data.
-
Dave Masalov
- Posts: 1712
- Joined: 16 Apr 2010
- Has thanked: 51 times
- Been thanked: 489 times
Re: MULTICHARTS 8.5 BETA 1 – WHAT’S NEW
Fernando,There's seems to be a bug here:
I selected a color as Custom Color...
This issue has been confirmed and added to our fix list. Thank you for reporting.
Re: MULTICHARTS 8.5 BETA 1 – WHAT’S NEW
Hi Dave,
Do you have the "Show Volume Profile" check box checked in Format Instrument -> Voulme Profile? If yes, and "Breakdown by" is set to "Ask vs Bid Traded", then it is normal that MC requests ask and bid tick data.
I have "Show Volume Profile" unchecked.
I tried to open a new chart as Heikin-Ashi and Quotemanager started directly to data request of bid and ask-Tick.
aiti
-
Dave Masalov
- Posts: 1712
- Joined: 16 Apr 2010
- Has thanked: 51 times
- Been thanked: 489 times
Re: MULTICHARTS 8.5 BETA 1 – WHAT’S NEW
Anyone else experience a crash soon after upgrading which produced the attached error message? It happened for me on two separate computers.
Crash and freeze always at start! Please see Pic. Any ideas?
What is the sequence of actions leading to the issue? Have you clicked on the Send button to send crash report to us? If no please save it to your hard drive and send to support@multicharts.com
If the issue is easy to reproduce, you can come to our Live Chat Mon-Fri from 6:30 AM to 4 PM EST so we can collect dump files for you: http://messenger.providesupport.com/mes ... pport.html
Re: MULTICHARTS 8.5 BETA 1 – WHAT’S NEW
I did send the report.
I just experienced a total MC freeze and had to force a shut down. I had 5 workspaces open each WS contained 4 charts all with autotrading turned on. This is a common set up for me and until 8.5, I never had a freeze, or crash for that matter.
I just experienced a total MC freeze and had to force a shut down. I had 5 workspaces open each WS contained 4 charts all with autotrading turned on. This is a common set up for me and until 8.5, I never had a freeze, or crash for that matter.
-
Dave Masalov
- Posts: 1712
- Joined: 16 Apr 2010
- Has thanked: 51 times
- Been thanked: 489 times
Re: MULTICHARTS 8.5 BETA 1 – WHAT’S NEW
aiti,Hi Dave,
Do you have the "Show Volume Profile" check box checked in Format Instrument -> Voulme Profile? If yes, and "Breakdown by" is set to "Ask vs Bid Traded", then it is normal that MC requests ask and bid tick data.
I have "Show Volume Profile" unchecked.
I tried to open a new chart as Heikin-Ashi and Quotemanager started directly to data request of bid and ask-Tick.
aiti
Please send us your workspace as well as .qmd file with data for the symbol (https://www.multicharts.com/trading-sof ... rting_Data).
-
Dave Masalov
- Posts: 1712
- Joined: 16 Apr 2010
- Has thanked: 51 times
- Been thanked: 489 times
Re: MULTICHARTS 8.5 BETA 1 – WHAT’S NEW
jl12,I too have found the text issue frustrating, apart from text filling not filling the cell it should be possible to truncate values for high volume contracts.
2 digits would generally suffice.
To see more data I have had to remove any thing other than text.
see attachment 2,
however there is still a lot of empty screen.
These types of issues seem to have been handled quite well by the Gomi+ ztb volume ladder addons in BMT for NT.
Toggling between views would is also a nice feature.
Please post a screenshot of the chart that you like in another platform.
-
Dave Masalov
- Posts: 1712
- Joined: 16 Apr 2010
- Has thanked: 51 times
- Been thanked: 489 times
Re: MULTICHARTS 8.5 BETA 1 – WHAT’S NEW
Your crash report is being analyzed. Thank you for reporting.I did send the report.
I just experienced a total MC freeze and had to force a shut down. I had 5 workspaces open each WS contained 4 charts all with autotrading turned on. This is a common set up for me and until 8.5, I never had a freeze, or crash for that matter.
Re: MULTICHARTS 8.5 BETA 1 – WHAT’S NEW
Dave here are examples of Fixed and Scaled to bar, though scaling to screen may also be helpful
- Attachments
-
- FIXEDDELTASCALE.png
- (131.28 KiB) Downloaded 17818 times
-
- MAXOFBARpng.png
- (124.56 KiB) Downloaded 17974 times
Last edited by jl12 on 19 Nov 2012, edited 1 time in total.
Re: MULTICHARTS 8.5 BETA 1 – WHAT’S NEW
I wanted to limit a study to the new chart types only, but both "Volume Delta" and "Cumulative Delta" return 256 using print (bartype);Hi Dave,
I have "Show Volume Profile" unchecked.
I tried to open a new chart as Heikin-Ashi and Quotemanager started directly to data request of bid and ask-Tick.
aiti
According to the help 256 stands for Heikin Ashi, maybe that causes the data request.
Re: MULTICHARTS 8.5 BETA 1 – WHAT’S NEW
donePlease send us your workspace as well as .qmd file with data for the symbol (https://www.multicharts.com/trading-sof ... rting_Data).
Re: MULTICHARTS 8.5 BETA 1 – WHAT’S NEW
Hi SP ,I wanted to limit a study to the new chart types only, but both "Volume Delta" and "Cumulative Delta" return 256 using print (bartype);Hi Dave,
I have "Show Volume Profile" unchecked.
I tried to open a new chart as Heikin-Ashi and Quotemanager started directly to data request of bid and ask-Tick.
aiti
According to the help 256 stands for Heikin Ashi, maybe that causes the data request.
I get the same problem if I build a chart with point&figure.
With regular charttype there is no request for Tick-data.
aiti
-
ABC

- Posts: 723
- Joined: 16 Dec 2006
- Location: www.abctradinggroup.com
- Has thanked: 125 times
- Been thanked: 410 times
- Contact:
Re: MULTICHARTS 8.5 BETA 1 – WHAT’S NEW
In the 32 bit version I can't open PL Editor from within MC via File -> Power Language Editor. This used to work fine in the previous version. Did anyone else notice that?
It opens fine when I directly open it via it's own shortcut on the desktop.
Thank you,
ABC
It opens fine when I directly open it via it's own shortcut on the desktop.
Thank you,
ABC
-
arnie
- Posts: 1594
- Joined: 11 Feb 2009
- Location: Portugal
- Has thanked: 481 times
- Been thanked: 514 times
Re: MULTICHARTS 8.5 BETA 1 – WHAT’S NEW
Do you mean File > New > PowerLanguage Editor?In the 32 bit version I can't open PL Editor from within MC via File -> Power Language Editor. This used to work fine in the previous version. Did anyone else notice that?
It opens fine when I directly open it via it's own shortcut on the desktop.
Thank you,
ABC
That's strange, I'm able to open it fine.
-
Henry MultiСharts

- Posts: 9165
- Joined: 25 Aug 2011
- Has thanked: 1264 times
- Been thanked: 2958 times
Re: MULTICHARTS 8.5 BETA 1 – WHAT’S NEW
Hello Jesh,I have found an issue when performing backtests / optimization and the primary instrument has the quote field set to Ask or Bid the back-testing results are empty.
If I have the quote field of the primary instrument set to Trade then I get some results back. This means I cannot run backtests with bar magnifier on.
Which data feed do you use? Are you able to plot the bid/ask series with the same resoultion on the chart in MultiCharts ?
-
ABC
- Posts: 723
- Joined: 16 Dec 2006
- Location: www.abctradinggroup.com
- Has thanked: 125 times
- Been thanked: 410 times
- Contact:
Re: MULTICHARTS 8.5 BETA 1 – WHAT’S NEW
Exactly. It might just be something on my end then.Do you mean File > New > PowerLanguage Editor?
That's strange, I'm able to open it fine.
Thank you.
-
Henry MultiСharts
- Posts: 9165
- Joined: 25 Aug 2011
- Has thanked: 1264 times
- Been thanked: 2958 times
Re: MULTICHARTS 8.5 BETA 1 – WHAT’S NEW
Hello arnie,I'd like to request Support to facilitate us a "workable" workspace with the TPO indicador applied to an ES chart, using IQFeed. I just can't seem to find the correct settings for this. Pretty stressful...
Thanks.
Please try the attached workspace.
- Attachments
-
- ES_TPO.wsp
- (125.91 KiB) Downloaded 962 times
-
- ES_TPO.png
- (112.19 KiB) Downloaded 17780 times
-
arnie
- Posts: 1594
- Joined: 11 Feb 2009
- Location: Portugal
- Has thanked: 481 times
- Been thanked: 514 times
Re: MULTICHARTS 8.5 BETA 1 – WHAT’S NEW
Thanks Henry, but unfortunately it's impossible to work with such a study. I really can't figure out what sessions those TPO's are referring too since they couldn't be more different when compared to a "real" TPO chart from another chart platform.Hello arnie,I'd like to request Support to facilitate us a "workable" workspace with the TPO indicador applied to an ES chart, using IQFeed. I just can't seem to find the correct settings for this. Pretty stressful...
Thanks.
Please try the attached workspace.
Re: MULTICHARTS 8.5 BETA 1 – WHAT’S NEW
I have installed MC 8.5 beta 1 32-bit and using IB-data.
When using chart-trader-panel the opening of orders with the buttons works well.
But the drag-and-drop strategies are not working.
aiti
When using chart-trader-panel the opening of orders with the buttons works well.
But the drag-and-drop strategies are not working.
aiti
Re: MULTICHARTS 8.5 BETA 1 – WHAT’S NEW
Same thing happened to me on the 64 bit version.In the 32 bit version I can't open PL Editor from within MC via File -> Power Language Editor. This used to work fine in the previous version. Did anyone else notice that?
It opens fine when I directly open it via it's own shortcut on the desktop.
Thank you,
ABC
-
CrazyNasdaq
- Posts: 322
- Joined: 02 Sep 2009
- Location: ITALY
- Has thanked: 98 times
- Been thanked: 90 times
Re: MULTICHARTS 8.5 BETA 1 – WHAT’S NEW
My works fine via MC icon. Same thing form PL Editor icon on the desktop.Same thing happened to me on the 64 bit version.In the 32 bit version I can't open PL Editor from within MC via File -> Power Language Editor. This used to work fine in the previous version. Did anyone else notice that?
It opens fine when I directly open it via it's own shortcut on the desktop.
Thank you,
ABC
MC 64 bit version
Re: MULTICHARTS 8.5 BETA 1 – WHAT’S NEW
I'm using DTN IQ feed and I am able to plot the bid/ask series with the same resoultion on the chart in MultiChartsHello Jesh,
Which data feed do you use? Are you able to plot the bid/ask series with the same resoultion on the chart in MultiCharts ?
-
CrazyNasdaq
- Posts: 322
- Joined: 02 Sep 2009
- Location: ITALY
- Has thanked: 98 times
- Been thanked: 90 times
Re: MULTICHARTS 8.5 BETA 1 – WHAT’S NEW
I'd like to suggest an other implementation regard Volume Profile.
It would be useful if could be possible to plot weekly Volume Profile. I've tried to plot VP every 5 sessions, but this way the Volume Profile is a rolling volume profile that shifts each new day for the last N sessions (5 to have a week).
Attached there is a picture where the vertical dashed line is the beginning of the week but the 5 sessions volume profile does not begin with the week.
My suggestion is to have a volume profile each N "session" or N "day" or N "Week" or " Month" and of course each N bars that is already implemented.
Anyway, congratulations for the very Good Work done with this beta version, surely the release will be wonderful.
- Attachments
-
- Weekly Volume Profile.png
- (176.35 KiB) Downloaded 17921 times
-
Dave Masalov
- Posts: 1712
- Joined: 16 Apr 2010
- Has thanked: 51 times
- Been thanked: 489 times
Re: MULTICHARTS 8.5 BETA 1 – WHAT’S NEW
CrazyNasdaq,I'd like to suggest an other implementation regard Volume Profile.
It would be useful if could be possible to plot weekly Volume Profile. I've tried to plot VP every 5 sessions, but this way the Volume Profile is a rolling volume profile that shifts each new day for the last N sessions (5 to have a week).
Attached there is a picture where the vertical dashed line is the beginning of the week but the 5 sessions volume profile does not begin with the week.
My suggestion is to have a volume profile each N "session" or N "day" or N "Week" or " Month" and of course each N bars that is already implemented.
Anyway, congratulations for the very Good Work done with this beta version, surely the release will be wonderful.
What session settings do you use?
-
Dave Masalov
- Posts: 1712
- Joined: 16 Apr 2010
- Has thanked: 51 times
- Been thanked: 489 times
Re: MULTICHARTS 8.5 BETA 1 – WHAT’S NEW
aiti,Hi Dave,
Do you have the "Show Volume Profile" check box checked in Format Instrument -> Voulme Profile? If yes, and "Breakdown by" is set to "Ask vs Bid Traded", then it is normal that MC requests ask and bid tick data.
I have "Show Volume Profile" unchecked.
I tried to open a new chart as Heikin-Ashi and Quotemanager started directly to data request of bid and ask-Tick.
aiti
The issue has been confirmed and added to our fix list. Thank you for reporting.
-
Dave Masalov
- Posts: 1712
- Joined: 16 Apr 2010
- Has thanked: 51 times
- Been thanked: 489 times
Re: MULTICHARTS 8.5 BETA 1 – WHAT’S NEW
aiti,I have installed MC 8.5 beta 1 32-bit and using IB-data.
When using chart-trader-panel the opening of orders with the buttons works well.
But the drag-and-drop strategies are not working.
aiti
This is a known issue. We are working on it at the moment.
-
CrazyNasdaq
- Posts: 322
- Joined: 02 Sep 2009
- Location: ITALY
- Has thanked: 98 times
- Been thanked: 90 times
Re: MULTICHARTS 8.5 BETA 1 – WHAT’S NEW
For DAX/EuroStoxx or BUND I use Eurex session (I've created an Eurex session from session templates) with exchange time which is the same as my local time (italian Time).CrazyNasdaq,
What session settings do you use?

-
Dave Masalov
- Posts: 1712
- Joined: 16 Apr 2010
- Has thanked: 51 times
- Been thanked: 489 times
Re: MULTICHARTS 8.5 BETA 1 – WHAT’S NEW
TO_Trader, ABC,Same thing happened to me on the 64 bit version.In the 32 bit version I can't open PL Editor from within MC via File -> Power Language Editor. This used to work fine in the previous version. Did anyone else notice that?
It opens fine when I directly open it via it's own shortcut on the desktop.
Thank you,
ABC
This issue has been confirmed and added to our fix list. Thank you for reporting.
-
Dave Masalov
- Posts: 1712
- Joined: 16 Apr 2010
- Has thanked: 51 times
- Been thanked: 489 times
Re: MULTICHARTS 8.5 BETA 1 – WHAT’S NEW
jl12,Dave, here are the 2 screen shots of the Es with Fixed scaling of 8000 the other with Maximum of bar.
Note how using Maximum of bar can result in volume spikes being missed.
A third method- scaling to maximum value on screen might be useful alternative.
Thank you for the screenshots. We will consider your suggestions for future implementation.
Re: MULTICHARTS 8.5 BETA 1 – WHAT’S NEW
Something else you may consider is the addition of a delta trade size filter,
this is standard on other products.
Viewing larger trade size deltas can filter out some noise when using cumulative delta and volume ladders.
this is standard on other products.
Viewing larger trade size deltas can filter out some noise when using cumulative delta and volume ladders.
- Attachments
-
- deltafilter.png
- (5.5 KiB) Downloaded 17872 times
-
arnie
- Posts: 1594
- Joined: 11 Feb 2009
- Location: Portugal
- Has thanked: 481 times
- Been thanked: 514 times
Re: MULTICHARTS 8.5 BETA 1 – WHAT’S NEW
Possible bug.
DOM is not showing a correct PnL.
Using Interactive Brokers.
DOM is not showing a correct PnL.
Using Interactive Brokers.
- Attachments
-
- DOM_PnL.png
- (24.25 KiB) Downloaded 21139 times
-
Henry MultiСharts
- Posts: 9165
- Joined: 25 Aug 2011
- Has thanked: 1264 times
- Been thanked: 2958 times
Re: MULTICHARTS 8.5 BETA 1 – WHAT’S NEW
Hello Jesh,I'm using DTN IQ feed and I am able to plot the bid/ask series with the same resoultion on the chart in MultiCharts
Are you able to replicate this behavior using prebuilt studies? If not, can you provide a sample script for reproducing it?
Please send me ( support@multicharts.com )the following information for further investigation:
- workspace you are using
- in QuoteManager select the symbol you are using, make a right click on it->Export data->Export instrument. Send me the Qmd export file for analysis.
- in Power Language editor->File->Export->export with dependent functions the studies you are using the workspaces you are providing. send me the study export file
- attach screenshots demonstrating the correct and incorrect behavior.
If the files are >10mb please send them via any file sharing service.
You can also come to our live chat Monday-Friday 6:30 am - 4 pm EST to demonstrate this behavior remotely and we will collect all required for analysis information.
-
arnie
- Posts: 1594
- Joined: 11 Feb 2009
- Location: Portugal
- Has thanked: 481 times
- Been thanked: 514 times
Re: MULTICHARTS 8.5 BETA 1 – WHAT’S NEW
Strange behavior.
Price marker got stuck at 1383.75 while prices were trading around 78's.
Changed periodicity to see if it would go back to normal but continued stuck. Not even after reloading the chart the marker went to normal.
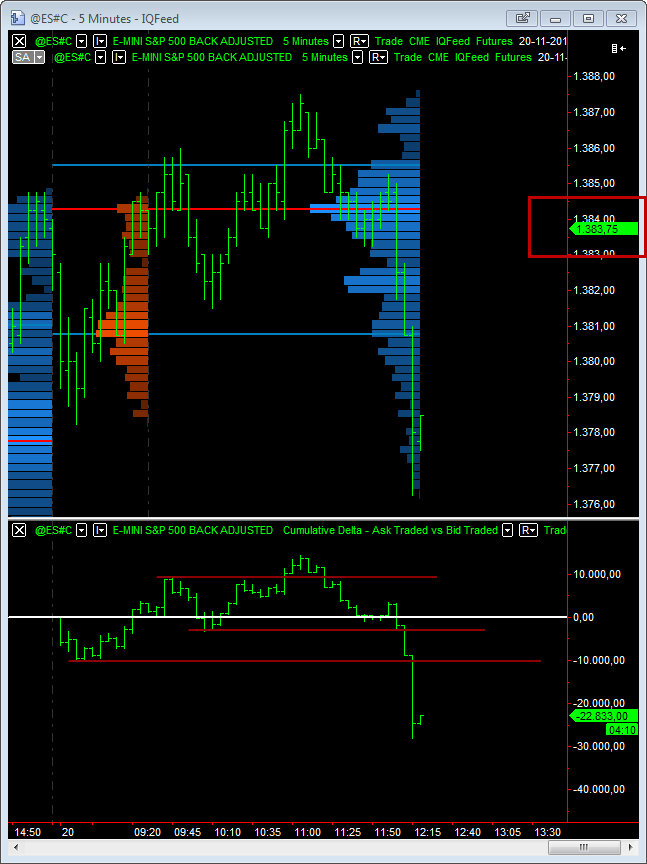
Price marker got stuck at 1383.75 while prices were trading around 78's.
Changed periodicity to see if it would go back to normal but continued stuck. Not even after reloading the chart the marker went to normal.
- Attachments
-
- 010.png
- (33.98 KiB) Downloaded 20714 times
-
Laurentius

- Posts: 90
- Joined: 01 Jan 2011
- Location: Europe
- Has thanked: 138 times
- Been thanked: 36 times
Re: MULTICHARTS 8.5 BETA 1 – WHAT’S NEW
I would just like to express my appreciation for the new version of MC.
I am now able to do everything I need to do in my analysis with MC only, no additional platforms. Becoming a really powerful tool I am really glad that I chose MC as my main platform. I would have no other.
Thanks a lot, I really appreciate it.
Best regards,
Laurentius
I am now able to do everything I need to do in my analysis with MC only, no additional platforms. Becoming a really powerful tool I am really glad that I chose MC as my main platform. I would have no other.
Thanks a lot, I really appreciate it.
Best regards,
Laurentius
-
Katrin Yanenko

- Posts: 55
- Joined: 28 Nov 2011
- Has thanked: 18 times
- Been thanked: 23 times
Re: MULTICHARTS 8.5 BETA 1 – WHAT’S NEW
Hi Arnie,Strange behavior.
Price marker got stuck at 1383.75 while prices were trading around 78's.
Changed periodicity to see if it would go back to normal but continued stuck. Not even after reloading the chart the marker went to normal.
On a chart you have three data series. Though all of them for one and the same symbol the sessions for data 1 and data 2 are different:
Data1 - US Equity Futures;
Data2 - IB US Equity Futures – RTH.
The price Scale is selected for data 2 and the Style in the Format Instrument for data 2 is set up as Invisible Bars.
It’s more likely that IB US Equity Futures – RTH session was over and US Equity Futures was still active.
So data 2 was not ticking and as the Price Scale had been set up for data 2, there was no movement of the price.
You can right click on the Price Scale and select data 1 as the one for Price Scale.
Also, why do you use data series in different sessions?
Best Regards,
Katrin Yanenko
-
arnie
- Posts: 1594
- Joined: 11 Feb 2009
- Location: Portugal
- Has thanked: 481 times
- Been thanked: 514 times
Re: MULTICHARTS 8.5 BETA 1 – WHAT’S NEW
Hi Katrin.Hi Arnie,
On a chart you have three data series. Though all of them for one and the same symbol the sessions for data 1 and data 2 are different:
Data1 - US Equity Futures;
Data2 - IB US Equity Futures – RTH.
The price Scale is selected for data 2 and the Style in the Format Instrument for data 2 is set up as Invisible Bars.
It’s more likely that IB US Equity Futures – RTH session was over and US Equity Futures was still active.
So data 2 was not ticking and as the Price Scale had been set up for data 2, there was no movement of the price.
You can right click on the Price Scale and select data 1 as the one for Price Scale.
Also, why do you use data series in different sessions?
Best Regards,
Katrin Yanenko
The reason I use a different session for a specific data series is because this way I’m able to color the profile for that session with a different color, allowing me to differentiate it when looking at a larger time period. Imagine that you are studying a year of data and you are looking for some pattern between the IB period (first 60min) and the rest of the day. If the profiles have all the same color it will be much more difficult for your eyes to pick up the different sessions. This way you can easy distinguish both sessions(periods).
Also, visually speaking, it’s very appealing.
The same thing can be said between the overnight and the RTH. Plotting 2 data series, each with the specific session, and each with a different profile color, when you overlay both you'll have each profile with a different color and looking at a year of data you can easily pick up which session is which, facilitating its reading.
Re: MULTICHARTS 8.5 BETA 1 – WHAT’S NEW
Hi Henry,Hello Jesh,
Are you able to replicate this behavior using prebuilt studies? If not, can you provide a sample script for reproducing it?
Please send me ( support@multicharts.com )the following information for further investigation:
- workspace you are using
- in QuoteManager select the symbol you are using, make a right click on it->Export data->Export instrument. Send me the Qmd export file for analysis.
- in Power Language editor->File->Export->export with dependent functions the studies you are using the workspaces you are providing. send me the study export file
- attach screenshots demonstrating the correct and incorrect behavior.
If the files are >10mb please send them via any file sharing service.
You can also come to our live chat Monday-Friday 6:30 am - 4 pm EST to demonstrate this behavior remotely and we will collect all required for analysis information.
I was able to resolve the issue I was experiencing. It seems that due to back-testing with tick data the performance report takes a lot longer to finalize its calculations, I left the charts open and running the back-testing running in the background and when I checked back later the performance report was displayed with data.
Thanks,
Jesh
Re: MULTICHARTS 8.5 BETA 1 – WHAT’S NEW
Hi Dave, Andrew told me the same in an email but I think this is not the case. Other charting packages fill in missing data from historical data and is one of the reasons IQFeed is the data feed of choice for traders using delta.Manuel,Hi guys, thanks for the update!
Can you please let me know if it is possible to access bid/ask volume from Easylanguage. I use IQ-Feed.
Regards, Manuel
Unfortunately, there is no way to get bid/ask volume from IQFeed. You can get bid/ask volume DOM data using Dom_asksize and Dom_bidsize keywords if your broker provides DOM data.
https://www.multicharts.com/trading-sof ... om_asksize
https://www.multicharts.com/trading-sof ... om_bidsize
This is what Jay Froscheieser of DTN said on the subject "We provide the bid and ask price at the time of trade within our historical tick data so software can more efficiently analyze the data." He went on to say...
"Every time we receive a trade message, the IQFeed client will also update/send the current bid/ask to the user's software (we do some of the heavy lifting in this case, but leave it up to the software to analyze it however it wants). The exchange doesn't send any type of flag/message indicating the bid/ask at the time of the trade. What we store in historical tick data is the same as what the client is being sent in real time as the ticks come in. This is where the real value occurs as you can be assured that what came through the stream matches history (except in the case of tick corrections/etc that we process to history)."
____________
I know I keep saying this but it is pretty important. You need three things for a fully functional delta implementation.
1) collect live bid ask and trade info from live data to calculate delta.
2) collect historic bid ask last info from a data feed (where it is provided) to fill in any 'holes' in the data from when MC is not running.
3) store enough information about the data collected in 1) & 2) to construct delta from the MC database (there are a couple of ways this could be done e.g. storing a sequence across bid ask last, calculating and storing delta, flagging each trade @bestbid or@bestask)
I am kind of concerned that all this fantastic work will be of limited use. As it stands now people will need to continue to use other delta tools unless they can keep there platforms running 24/7 or are only interested in very short term relative delta values. I don't think people realise yet that delta is currently only accurate on live data. (Unless I have misunderstood things).
Again I apologise about keeping banging on about this. I am really excited about these great new features but concerned that the implementation might not be robust and accurate.
-
Andrew Kirillov

- Posts: 1589
- Joined: 28 Jul 2005
- Has thanked: 2 times
- Been thanked: 31 times
- Contact:
Re: MULTICHARTS 8.5 BETA 1 – WHAT’S NEW
Nick,
1. Could you specify software that works identical with real-time and historical data?
2. Take a look at the picture attached. That is the native IQfeed client. You can see that the trade price doesn't match either bid or ask. Ideas?
1. Could you specify software that works identical with real-time and historical data?
2. Take a look at the picture attached. That is the native IQfeed client. You can see that the trade price doesn't match either bid or ask. Ideas?
- Attachments
-
- iqfeed_HT.png
- (49.9 KiB) Downloaded 17930 times
-
ABC
- Posts: 723
- Joined: 16 Dec 2006
- Location: www.abctradinggroup.com
- Has thanked: 125 times
- Been thanked: 410 times
- Contact:
Re: MULTICHARTS 8.5 BETA 1 – WHAT’S NEW
Andrew,Nick,
1. Could you specify software that works identical with real-time and historical data?
2. Take a look at the picture attached. That is the native IQfeed client. You can see that the trade price doesn't match either bid or ask. Ideas?
that is an interesting example, thank you for sharing.
If the trade price is lower than the reported Bid prize, I think it's a save bet to count it as trade at Bid. However this raises the interesting question, how reliable is the reported data? Assume the price was reported at 92.75 - was it really happening at the bid prize or is it just a similiar situation like on your picture, where in fact the ask already shifted, but IQFeed didn't show the correct bid/ask stream, yet. The trade would be counted as bid trade, where in fact it occured at the ask.
This of course is a datafeed problem and there probably is no better solution than to live with these problems in my opinion.
Regards,
ABC
-
CrazyNasdaq
- Posts: 322
- Joined: 02 Sep 2009
- Location: ITALY
- Has thanked: 98 times
- Been thanked: 90 times
Re: MULTICHARTS 8.5 BETA 1 – WHAT’S NEW
My ZN chart and delta seems okIs it me or it's a bit odd to see treasuries cumulative delta quoted that way.

Re: MULTICHARTS 8.5 BETA 1 – WHAT’S NEW
Hi Andrew,Nick,
1. Could you specify software that works identical with real-time and historical data?
2. Take a look at the picture attached. That is the native IQfeed client. You can see that the trade price doesn't match either bid or ask. Ideas?
Delta is based on an algorithm Lee & Ready described in a paper they wrote way back in 1991. The basic algorithm used the 'quote rule' to classify 'trade direction' if a trade occurs above the mid point between best bid and best ask its 'a buy' (+ve delta) if below the mid point it is 'a sell' (-ve delta). Trades that occur exactly at the mid point are classified using the 'tick rule' (was the last change in price an uptick or a downtick).
Since then lots of academic studies have been done of the efficacy of the algorithm and in a paper they published in 2000 The Accuracy of Trade Classification Rules: Evidence from Nasdaq Ellis, Michaely and O'Hara after testing with a database supplied by the Nasdaq suggested this improvement ....
All trades executed at the prevailing ask quote are categorized as buys. All trades executed at the prevailing bid quote are categorized as sells. All other trades are categorized by the tick rule. After reading there paper I am pretty sure they apply the tick rule to trades outside the spread too. (like your example).
There has been loads academic research done on this and numerous papers are available on the internet (some free some for a small fee).
I suspect that IRT and SC use the original Lee & Ready algorithm though I'd like to see the second algorithm (perhaps as an option as people will want to compare results to other packages and using a different algorithm even if it is 'better' will mess up those comparisons).
You do get trades between best bid and best ask or even outside the spread, again there are papers written about why this might be and how it might effect efficacy of the algorithm.
Cheers,
Nick.
-
arnie
- Posts: 1594
- Joined: 11 Feb 2009
- Location: Portugal
- Has thanked: 481 times
- Been thanked: 514 times
Re: MULTICHARTS 8.5 BETA 1 – WHAT’S NEW
First, I want to thank the forum developers for how images are now handled. Much better now. Thank you.My ZN chart and delta seems ok
You are correct CrazyNasdaq, zooming in/out or expand/contract the price scale will "remove" the fraction indication of the scale but it continues to be there. It will be visible from time to time and it will always be odd to see it.
There's a thread on the forum where I already talked about how MC is quoting treasuries and how they should change that so there's no point in talking about it in here.
-
Andrew Kirillov
- Posts: 1589
- Joined: 28 Jul 2005
- Has thanked: 2 times
- Been thanked: 31 times
- Contact:
Re: MULTICHARTS 8.5 BETA 1 – WHAT’S NEW
Nick,
Thanks for your comments. So you believe that MD/IRT backfills footprint charts right? Am I correct?
Thanks for your comments. So you believe that MD/IRT backfills footprint charts right? Am I correct?
-
Dave Masalov
- Posts: 1712
- Joined: 16 Apr 2010
- Has thanked: 51 times
- Been thanked: 489 times
Re: MULTICHARTS 8.5 BETA 1 – WHAT’S NEW
arnie,First, I want to thank the forum developers for how images are now handled. Much better now. Thank you.My ZN chart and delta seems ok
You are correct CrazyNasdaq, zooming in/out or expand/contract the price scale will "remove" the fraction indication of the scale but it continues to be there. It will be visible from time to time and it will always be odd to see it.
There's a thread on the forum where I already talked about how MC is quoting treasuries and how they should change that so there's no point in talking about it in here.
To get rid of fractional scale you need to open Format Instrument window for the cumulative delta series, select Scaling tab, check the 'Set Labels Manually" check box and set Step Size = 1.
Re: MULTICHARTS 8.5 BETA 1 – WHAT’S NEW
I assumed that MC would also have 120 days available from IQ, however from the discussion on this thread and gaps in my charts I gather this is not the case.
I use IRT to study Delta and NT Gomi add-ons for Footprints both of which use IQ data and pull in 120 days of Bid/ask out of market hours.
In the big mike forum BID/ASK data is shared by users, making it possible to upload data older than 120 days.
I don't use my IB data for delta footprint analysis, I tested it in the past and found that
it gives different results to iq, I am informed that this is due to the way IB sends the quotes.
Could someone clarify where the footprint data for is coming from and how much should be available.
-
arnie
- Posts: 1594
- Joined: 11 Feb 2009
- Location: Portugal
- Has thanked: 481 times
- Been thanked: 514 times
Re: MULTICHARTS 8.5 BETA 1 – WHAT’S NEW
If you have gaps on your charts then something went wrong there. You really need to download that amount of data outside market hours.I assumed that MC would also have 120 days available from IQ, however from the discussion on this thread and gaps in my charts I gather this is not the case.
I use IRT to study Delta and NT Gomi add-ons for Footprints both of which use IQ data and pull in 120 days of Bid/ask out of market hours.
You also can try and delete the data you have and download new one.
Last weekend I downloaded all 120 days and had no problem with it.
Re: MULTICHARTS 8.5 BETA 1 – WHAT’S NEW
Thanks Arnie I'll have another try this weekend.You also can try and delete the data you have and download new one.
Last weekend I downloaded all 120 days and had no problem with it.
-
CrazyNasdaq
- Posts: 322
- Joined: 02 Sep 2009
- Location: ITALY
- Has thanked: 98 times
- Been thanked: 90 times
Re: MULTICHARTS 8.5 BETA 1 – WHAT’S NEW
I'd like to suggest a feature about Cumulative Delta.
Cumulative Delta for renko chart or other "NON regular" charts
It would be fully completed the Cumulative Delta (like other Delta Softwares) if we could use CD even for NON regular charts.
This way it does not work properly.

Cumulative Delta for renko chart or other "NON regular" charts
It would be fully completed the Cumulative Delta (like other Delta Softwares) if we could use CD even for NON regular charts.
This way it does not work properly.
Re: MULTICHARTS 8.5 BETA 1 – WHAT’S NEW
Nick,
Thanks for your comments. So you believe that MD/IRT backfills footprint charts right? Am I correct?
Yes I believe so. Using the mechanism described by the DTN guy I quoted in my first post I presume. It also fills cumulative delta from historical data that matches live.
Last edited by Nick on 24 Nov 2012, edited 1 time in total.
Re: MULTICHARTS 8.5 BETA 1 – WHAT’S NEW
Yes, gaps are probablly something else.If you have gaps on your charts then something went wrong there. You really need to download that amount of data outside market hours.I assumed that MC would also have 120 days available from IQ, however from the discussion on this thread and gaps in my charts I gather this is not the case.
I use IRT to study Delta and NT Gomi add-ons for Footprints both of which use IQ data and pull in 120 days of Bid/ask out of market hours.
You also can try and delete the data you have and download new one.
Last weekend I downloaded all 120 days and had no problem with it.
The big issue (from what I understand) is that historical data is averaged using the technique described in the MC blog, and so is not accurate like live data.
If you collect live data for a couple of days and compare it with a similar chart where data that has been refreshed from historical data I think you will see a difference. Have you compared live collected and refreshed?
Interactive Brokers samples and aggregates data which makes it essentially useless for delta work. The way I read things (which may be wrong, wouldn't be the first time!) the algorithm that MC is using on historical data does a similar sampling though with a much coarser (worse) granularity.
Cheers,
-
arnie
- Posts: 1594
- Joined: 11 Feb 2009
- Location: Portugal
- Has thanked: 481 times
- Been thanked: 514 times
Re: MULTICHARTS 8.5 BETA 1 – WHAT’S NEW
In terms of real-time collected data and historical data I did find some discrepancies but it's being investigated by MC developers so let's wait (I don't know if it's a MC problem or was I that didn't do things correctly). MC is still on beta 1. I'm sure till the final version we'll see a couple of more beta versions which will not only introduce new features but also fix bugs and other problems that might appear.Yes, gaps are probablly something else.
The big issue (from what I understand) is that historical data is averaged using the technique described in the MC blog, and so is not accurate like live data.
If you collect live data for a couple of days and compare it with a similar chart where data that has been refreshed from historical data I think you will see a difference. Have you compared live collected and refreshed?
Interactive Brokers samples and aggregates data which makes it essentially useless for delta work. The way I read things (which may be wrong, wouldn't be the first time!) the algorithm that MC is using on historical data does a similar sampling though with a much coarser (worse) granularity.
Cheers,
But I do agree that MC should be able to collect all missing data automatically, specially when the connection is lost.
When data connection is lost, due to internet loss, MC should have the capability to detect that connection loss, warn us and as soon the data connection is ON again, it should be able to download all missing data during that period.
Re: MULTICHARTS 8.5 BETA 1 – WHAT’S NEW
Apreciated the effort, was a lot of time hoping to have a Footprint & CVD + vol Profile in MC, hope to soon stop using MD to have those infos...
Downloaded the 8.5 beta1 Vol profile works fine.
Having some problems with Footprint & CVD, I obtain only ask values bid is always Zero, so the CVD is an always growing chart.... I'm using Rithmic01 datafeed, it works fine, I compared it in MD with IQFeed (that is the point of reference) and it gives exactely the same footprint & CVD
So I suppose it is not the feed..?!?
Or it doesn't work fine with MC?!?
Am I not setting something properly? seems that ask value are missing..
BMS
- Attachments
-
- CVD Example.jpg
- CVD Example
- (224.92 KiB) Downloaded 17827 times
-
- Volume Delta Example.jpg
- Volume Delta example
- (254.65 KiB) Downloaded 17861 times
Re: MULTICHARTS 8.5 BETA 1 – WHAT’S NEW
The menus have disappeared from power editor, I ran repair for 8.5, rebooted but still nothing, any ideas?
- Attachments
-
- powereditor.png
- (22.09 KiB) Downloaded 17907 times
Re: MULTICHARTS 8.5 BETA 1 – WHAT’S NEW
Hi Arnie,
In terms of real-time collected data and historical data I did find some discrepancies but it's being investigated by MC developers so let's wait (I don't know if it's a MC problem or was I that didn't do things correctly). MC is still on beta 1. I'm sure till the final version we'll see a couple of more beta versions which will not only introduce new features but also fix bugs and other problems that might appear.
But I do agree that MC should be able to collect all missing data automatically, specially when the connection is lost.
When data connection is lost, due to internet loss, MC should have the capability to detect that connection loss, warn us and as soon the data connection is ON again, it should be able to download all missing data during that period.
Yes I am excited for this great new feature but of course happy to wait for them to get right. I think the issue is this (quoted from the blog).
"Important information: The logic described above is for data collected in real-time. The following logic is used for historical plots. Example: Assume there are 3 historical trades, 9 historical bid quotes and 12 historical ask quotes. All of them have the same timestamp. To find out which historical asks and bids were used to generate the trades, they are all divided into 3 equal parts (because there are 3 trades). the first “batch” there are 3 asks, 1 trade and 4 bids. The most recent ask/bid matching the trade price is considered to be the price where the trade was made. If ask price is considered for the fill, then the trade’s volume goes to BUY volume. If bid is considered for the fill, then the trade’s volume goes to SELL volume."
Coalescing the data like this wont produce good results. Of course I appreciate this is beta, which is exactly why I am pointing out the issue, the thing is its more of an architectural issue which I have been banging on about for ages (much to everyone's annoyance I'm sure
-
Andrew Kirillov
- Posts: 1589
- Joined: 28 Jul 2005
- Has thanked: 2 times
- Been thanked: 31 times
- Contact:
Re: MULTICHARTS 8.5 BETA 1 – WHAT’S NEW
Nick,
The hsitorical volume delta charts will be identical to MD in beta 2 since we use your suggested additional IQ feed information. It is only true for IQfeed.
The hsitorical volume delta charts will be identical to MD in beta 2 since we use your suggested additional IQ feed information. It is only true for IQfeed.
Re: MULTICHARTS 8.5 BETA 1 – WHAT’S NEW
Andrew,
if you open 2 Cumulative Delta charts, one with Ask Traded vs Bid Traded and one Up Tick vs Down Tick, both return the same UpVol and DnVol values using Upticks/Downticks in PowerLanguage and at the Data Window.
Could that be changed that with Ask Traded vs Bid Traded the volume values traded at ask and bid are returned else we always need to calculate these values separate in indicators as
Code: Select all
// Upvol/DnVol at Cumulative Delta charts with Ask Traded vs Bid Traded

VOP = Close - Close[1];

If VOP > 0 then

	begin

		MyAskTradedVol = (Ticks-VOP)/2 + VOP;

		MyBidTradedVol = (Ticks-VOP)/2 ;

	end

	else If VOP < 0 then

	begin

		MyAskTradedVol = (Ticks+VOP)/2 ;

		MyBidTradedVol = (Ticks+VOP)/2 - VOP;

	end

	else If VOP = 0 then

	begin

		MyAskTradedVol = (Ticks)/2 ;

		MyBidTradedVol = (Ticks)/2 ;

	end	;
-
Dave Masalov
- Posts: 1712
- Joined: 16 Apr 2010
- Has thanked: 51 times
- Been thanked: 489 times
Re: MULTICHARTS 8.5 BETA 1 – WHAT’S NEW
Hello SP,Andrew,
if you open 2 Cumulative Delta charts, one with Ask Traded vs Bid Traded and one Up Tick vs Down Tick, both return the same UpVol and DnVol values using Upticks/Downticks in PowerLanguage and at the Data Window.
Could that be changed that with Ask Traded vs Bid Traded the volume values traded at ask and bid are returned else we always need to calculate these values separate in indicators as
Code: Select all
// Upvol/DnVol at Cumulative Delta charts with Ask Traded vs Bid Traded

VOP = Close - Close[1];

If VOP > 0 then

	begin

		MyAskTradedVol = (Ticks-VOP)/2 + VOP;

		MyBidTradedVol = (Ticks-VOP)/2 ;

	end

	else If VOP < 0 then

	begin

		MyAskTradedVol = (Ticks+VOP)/2 ;

		MyBidTradedVol = (Ticks+VOP)/2 - VOP;

	end

	else If VOP = 0 then

	begin

		MyAskTradedVol = (Ticks)/2 ;

		MyBidTradedVol = (Ticks)/2 ;

	end	;
Thank you for your suggestion. We will consider it for future implementation.
-
Dave Masalov
- Posts: 1712
- Joined: 16 Apr 2010
- Has thanked: 51 times
- Been thanked: 489 times
Re: MULTICHARTS 8.5 BETA 1 – WHAT’S NEW
jl12,The menus have disappeared from power editor, I ran repair for 8.5, rebooted but still nothing, any ideas?
Please delete the following treads in the Windows registry Editor:
HKEY_CURRENT_USER\Software\TS Support\MultiCharts64\PowerLanguage Editor
or
HKEY_CURRENT_USER\Software\TS Support\MultiCharts\PowerLanguage Editor
-
Dave Masalov
- Posts: 1712
- Joined: 16 Apr 2010
- Has thanked: 51 times
- Been thanked: 489 times
Re: MULTICHARTS 8.5 BETA 1 – WHAT’S NEW
Hello BMS,Apreciated the effort, was a lot of time hoping to have a Footprint & CVD + vol Profile in MC, hope to soon stop using MD to have those infos...
Downloaded the 8.5 beta1 Vol profile works fine.
Having some problems with Footprint & CVD, I obtain only ask values bid is always Zero, so the CVD is an always growing chart.... I'm using Rithmic01 datafeed, it works fine, I compared it in MD with IQFeed (that is the point of reference) and it gives exactely the same footprint & CVD
So I suppose it is not the feed..?!?
Or it doesn't work fine with MC?!?
Am I not setting something properly? seems that ask value are missing..
BMS
Rithmic does not provide historical ask and bid data in MultiCharts. So there is simply not enough data to plot Footprint & CVD. If you collect data in real-time, the charts should plot ok.
Re: MULTICHARTS 8.5 BETA 1 – WHAT’S NEW
Tks Dave,
just tried and in realtime it gives a correct Footprint.. would be interesting to have the avalaibility of historical data... just like IQ gives..
By the way I'm would it be possible to insert the possibility to graph the volume delta chart in profile with also bid x ask like the it is possible in MD (see attatched).
regards
BMS
- Attachments
-
- Profile +Bid X Ask.jpg
- (177.26 KiB) Downloaded 17925 times
-
arnie
- Posts: 1594
- Joined: 11 Feb 2009
- Location: Portugal
- Has thanked: 481 times
- Been thanked: 514 times
Re: MULTICHARTS 8.5 BETA 1 – WHAT’S NEW
I'm not able to make a snapshot of my screens at the moment but it's quite easy to do.By the way I'm would it be possible to insert the possibility to graph the volume delta chart in profile with also bid x ask like the it is possible in MD (see attatched).
regards
BMS
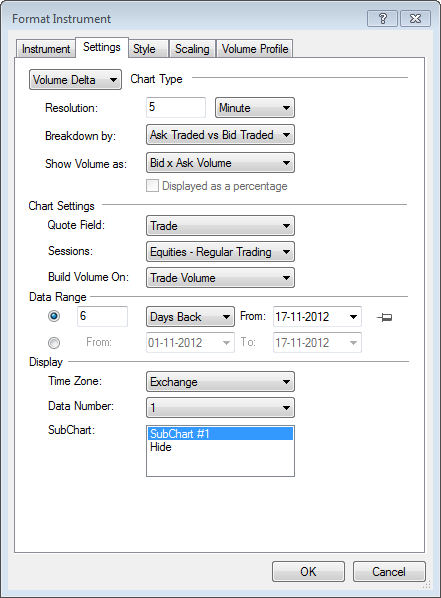
Set the chart with the resolution you want, ex: 5 min.
Then go to volume profile, check Every 1 bar and select buy x sell volume and breakdown by ask vs bid traded.
I believe that will give you the reading you want.
Re: MULTICHARTS 8.5 BETA 1 – WHAT’S NEW
Arnie, Tks a lot,
yes we can obtain the same thing as with MD, Very nice, great!!
Attached the setting on a 5min (candlestick invisible +volume profile x bar as you said)
good trading
BMS
yes we can obtain the same thing as with MD, Very nice, great!!
Attached the setting on a 5min (candlestick invisible +volume profile x bar as you said)
good trading
BMS
- Attachments
-
- Footprint profile.jpg
- (266.33 KiB) Downloaded 17952 times
-
Dave Masalov
- Posts: 1712
- Joined: 16 Apr 2010
- Has thanked: 51 times
- Been thanked: 489 times
Re: MULTICHARTS 8.5 BETA 1 – WHAT’S NEW
jl12,Dave, here are the 2 screen shots of the Es with Fixed scaling of 8000 the other with Maximum of bar.
Note how using Maximum of bar can result in volume spikes being missed.
A third method- scaling to maximum value on screen might be useful alternative.
What scaling method do you consider to be the best option: scaling to the maximum value on the screen or scaling to the maximum value of the session?
-
Dave Masalov
- Posts: 1712
- Joined: 16 Apr 2010
- Has thanked: 51 times
- Been thanked: 489 times
Re: MULTICHARTS 8.5 BETA 1 – WHAT’S NEW
Jesh,Can you please add P&F chart type for the Volume Delta chart. This is what I use in MD and it's not available in the current beta.
Thanks.
Please post a screenshot of the chart type that you are referring to. How exactly is it plotted?
-
Dave Masalov
- Posts: 1712
- Joined: 16 Apr 2010
- Has thanked: 51 times
- Been thanked: 489 times
Re: MULTICHARTS 8.5 BETA 1 – WHAT’S NEW
It is unlikely that we implement tick-by-tick playback on Volume Delta charts in the near future due to the complexity of this feature.Will we see (in a future MC version) tick by tick playback on volume delta bars?
-
arnie
- Posts: 1594
- Joined: 11 Feb 2009
- Location: Portugal
- Has thanked: 481 times
- Been thanked: 514 times
Re: MULTICHARTS 8.5 BETA 1 – WHAT’S NEW
So this means that it will be possible to see tick by tick playback, just not in the near future.It is unlikely that we implement tick-by-tick playback on Volume Delta charts in the near future due to the complexity of this feature.
Re: MULTICHARTS 8.5 BETA 1 – WHAT’S NEW
Until enough information is stored in the MC database to accurately construct delta it is not possible to construct delta from historical data let alone play it back tick by tick, there is nothing stored to play or plot it.So this means that it will be possible to see tick by tick playback, just not in the near future.It is unlikely that we implement tick-by-tick playback on Volume Delta charts in the near future due to the complexity of this feature.
@Andrew/TSSupport great news about IQfeed. That will make lots of people happy. Do you plan on storing this info in the MC database at some stage? This would allow users to plot delta from further back than IQfeeds tick history.
A̶r̶e̶-̶y̶o̶u̶-̶s̶u̶r̶e̶-̶t̶h̶a̶t̶-̶t̶h̶e̶r̶e̶-̶i̶s̶-̶n̶o̶-̶h̶i̶s̶t̶o̶r̶i̶c̶a̶l̶-̶b̶i̶d̶-̶a̶s̶k̶-̶d̶a̶t̶a̶-̶f̶r̶o̶m̶-̶R̶|̶t̶h̶m̶i̶c̶?̶-̶I̶-̶a̶m̶-̶t̶o̶l̶d̶-̶t̶h̶a̶t̶-̶t̶h̶e̶y̶-̶p̶r̶o̶v̶i̶d̶e̶
-̶3̶0̶-̶d̶a̶y̶s̶-̶(̶t̶h̶o̶u̶g̶h̶-̶i̶t̶-̶i̶s̶-̶b̶y̶-̶o̶n̶e̶-̶o̶f̶-̶m̶y̶-̶b̶r̶o̶k̶e̶r̶s̶-̶r̶a̶t̶h̶e̶r̶-̶t̶h̶a̶n̶-̶R̶|̶t̶h̶m̶i̶c̶-̶t̶h̶e̶m̶s̶e̶l̶v̶e̶s̶,̶-̶h̶e̶-̶s̶a̶y̶s̶-̶h̶e̶-̶i̶s̶-̶p̶r̶e̶t̶t̶y̶-̶c̶e̶r̶t̶a̶i̶n̶)̶.̶
J̶u̶s̶t̶-̶a̶s̶k̶i̶n̶g̶-̶a̶s̶-̶t̶h̶e̶-̶o̶f̶f̶i̶c̶i̶a̶l̶-̶T̶S̶S̶u̶p̶p̶o̶r̶t̶-̶p̶o̶s̶i̶t̶i̶o̶n̶-̶w̶a̶s̶-̶t̶h̶a̶t̶-̶I̶Q̶f̶e̶e̶d̶-̶d̶i̶d̶-̶n̶o̶t̶-̶p̶r̶o̶v̶i̶d̶e̶ t̶h̶i̶s̶-̶i̶n̶f̶o̶r̶m̶a̶t̶i̶o̶n̶-̶u̶n̶t̶i̶l̶-̶I̶-̶p̶o̶i̶n̶t̶e̶d̶-̶o̶u̶t̶-̶t̶h̶e̶-̶p̶o̶s̶t̶s̶-̶f̶r̶o̶m̶-̶J̶a̶y̶-̶a̶t̶-̶D̶T̶N̶.
Edit: thinking about it he is probablly wrong and it is data provided by one of the 'platform' providers built on the R|thmic infrastructure. The limited (single session) R|thmic backfill has no bid ask data though?
Cheers, Nick.
Last edited by Nick on 29 Nov 2012, edited 2 times in total.
Re: MULTICHARTS 8.5 BETA 1 – WHAT’S NEW
On the subject of volume profile. A couple of features that would be very useful.
1) easiest first. Being able to plot the developing value area / volume point of control. Normally VA from the previous period is plotted in the current period. It is very useful to plot the current periods VA as it develops. Developing vpoc is very useful too. it changes as the period progresses but show developing value. Someone requested this a few posts back. I know of a couple of trading groups that use this.
2) it would be very useful to define the start and end of a profile to any pair of bars on he chart. An 'irregular profile' if you like. An example use is in a ranging market you might want to select that range to see where value lies within it. The value area makes a good place to anticipate support/resistance. Long story short you want to draw profiles around market structure rather than fixed arbitrary time periods. Lots of profile traders and groups use profiles selected like this.
The big issue is how to select the range of bars to draw a profile for. E.g. IRT allows you to click and drag from first bar to last bar, FinAlg (add on for NT) allows you to join profiles or break them apart at a certain bar, less intuitive and more difficult to manage IMO.
-
arnie
- Posts: 1594
- Joined: 11 Feb 2009
- Location: Portugal
- Has thanked: 481 times
- Been thanked: 514 times
Re: MULTICHARTS 8.5 BETA 1 – WHAT’S NEW
Beta 2 will have this option available.1) easiest first. Being able to plot the developing value area / volume point of control. Normally VA from the previous period is plotted in the current period. It is very useful to plot the current periods VA as it develops. Developing vpoc is very useful too. it changes as the period progresses but show developing value. Someone requested this a few posts back. I know of a couple of trading groups that use this.
You actually can do this now by selecting a start date/time and end date/time. Yes, it's really not the best way to do it since you need to take note of the bars you want to read and then open the settings and select them from the calendar. This is how SC does it. IRT way is much more user friendly and fast.2) it would be very useful to define the start and end of a profile to any pair of bars on he chart. An 'irregular profile' if you like. An example use is in a ranging market you might want to select that range to see where value lies within it. The value area makes a good place to anticipate support/resistance. Long story short you want to draw profiles around market structure rather than fixed arbitrary time periods. Lots of profile traders and groups use profiles selected like this.
The big issue is how to select the range of bars to draw a profile for. E.g. IRT allows you to click and drag from first bar to last bar, FinAlg (add on for NT) allows you to join profiles or break them apart at a certain bar, less intuitive and more difficult to manage IMO.
Let's hope that in a future version they can add this tool option.
Re: MULTICHARTS 8.5 BETA 1 – WHAT’S NEW
Brilliant news Arnie. I must be honest I have not even tried the new beta as there are a couple of things (like these) that I would need to see to make it useful fir me.
I have no excuse now!
I have no excuse now!
-
Dave Masalov
- Posts: 1712
- Joined: 16 Apr 2010
- Has thanked: 51 times
- Been thanked: 489 times
Re: MULTICHARTS 8.5 BETA 1 – WHAT’S NEW
Nick,R|thmic backfill has no bid ask data though?
We contacted Rithmic to confirm this. Here is the response by Jonathan Walden from Rithmic:
We do not provide such a mechanism.
Re: MULTICHARTS 8.5 BETA 1 – WHAT’S NEW
Thanks for taking the time to confirm this.Nick,R|thmic backfill has no bid ask data though?
We contacted Rithmic to confirm this. Here is the response by Jonathan Walden from Rithmic:
We do not provide such a mechanism.
Re: MULTICHARTS 8.5 BETA 1 – WHAT’S NEW
I have a problem with Lmax data feed. Some symbols lack ability to plaot daily bars.
- Attachments
-
- Lmax daily candles.png
- (55.55 KiB) Downloaded 17806 times
-
Henry MultiСharts
- Posts: 9165
- Joined: 25 Aug 2011
- Has thanked: 1264 times
- Been thanked: 2958 times
Re: MULTICHARTS 8.5 BETA 1 – WHAT’S NEW
In Multicharts please go to File tab->Preferences->Data server modeI have a problem with Lmax data feed. Some symbols lack ability to plaot daily bars.
Make sure you are in online mode, "download missing historical data" is enabled
Try to reload the chart using Ctrl+R if you still have the problem.
Re: MULTICHARTS 8.5 BETA 1 – WHAT’S NEW
It doesn't work. there are tick data and minute data for the symbols in QM but not daily data for some symbols. i suspect this is the issue on Lmax's end.In Multicharts please go to File tab->Preferences->Data server mode
Make sure you are in online mode, "download missing historical data" is enabled
Try to reload the chart using Ctrl+R if you still have the problem.
-
sptrader

- Posts: 742
- Joined: 09 Apr 2010
- Location: Texas
- Has thanked: 483 times
- Been thanked: 274 times
- Contact:
Re: MULTICHARTS 8.5 BETA 1 – WHAT’S NEW
********************************************************It doesn't work. there are tick data and minute data for the symbols in QM but not daily data for some symbols. i suspect this is the issue on Lmax's end.In Multicharts please go to File tab->Preferences->Data server mode
Make sure you are in online mode, "download missing historical data" is enabled
Try to reload the chart using Ctrl+R if you still have the problem.
You might try using "24 hour" bars and see if that works..

Re: MULTICHARTS 8.5 BETA 1 – WHAT’S NEW
The new commission types are nice to have. A bit complicated.. but I like the options.
- can we have the ability to save our commissions type and amount as a default for future charts?
*bug* the new commissions are not being calculated correctly. Look into this..
- can we have the ability to save our commissions type and amount as a default for future charts?
*bug* the new commissions are not being calculated correctly. Look into this..
Re: MULTICHARTS 8.5 BETA 1 – WHAT’S NEW
That will work.You might try using "24 hour" bars and see if that works..
BTW, there are some problems with Lmax data, e.g. bad ticks on .../HUF pairs (see daily resolutions). Unreliable traded volume (spikes out of the blue when compared to tick volume).
I would have shown the above on screenshots but MC 8.5 beta 1 crashed again on me today and is unresponsive. 7 crashes yesterday with Lmax data and 3 today (always occuring when I try to change resolution from 1 minute / 5 minutes / 20 minutes into daily resolution). yes, I know it is a beta, so I am not grumbling but pointing out fields for improvement.
Re: MULTICHARTS 8.5 BETA 1 – WHAT’S NEW
Screen might be preferable, using session could give odd values at the start of a session before liquidity is established.Dave, here are the 2 screen shots of the Es with Fixed scaling of 8000 the other with Maximum of bar.
Note how using Maximum of bar can result in volume spikes being missed.
A third method- scaling to maximum value on screen might be useful alternative.
jl12,
What scaling method do you consider to be the best option: scaling to the maximum value on the screen or scaling to the maximum value of the session?
Last edited by jl12 on 30 Nov 2012, edited 1 time in total.
Re: MULTICHARTS 8.5 BETA 1 – WHAT’S NEW
I am having a problem with iqfeed on MC.
IQ feed data on MC is currently lagging the prices IQ are broadcasting by over 10 seconds, also not all ticks are coming through.
Iq feed seems to be fine.
I have spoken to support and apparently I am not the only user with the issue, so something to be look out for.
IQ feed data on MC is currently lagging the prices IQ are broadcasting by over 10 seconds, also not all ticks are coming through.
Iq feed seems to be fine.
I have spoken to support and apparently I am not the only user with the issue, so something to be look out for.
-
Dave Masalov
- Posts: 1712
- Joined: 16 Apr 2010
- Has thanked: 51 times
- Been thanked: 489 times
Re: MULTICHARTS 8.5 BETA 1 – WHAT’S NEW
Hello MAtricks,*bug* the new commissions are not being calculated correctly. Look into this..
Please explain the issue in details. What exactly is not calculated correctly?
Have you read the description of the commission rules feature: https://www.multicharts.com/trading-sof ... ommissions
You may want to come to our Live Chat Mon-Fri from 6:30 AM to 4 PM EST to demonstrate the issue: http://messenger.providesupport.com/mes ... pport.html
-
Dave Masalov
- Posts: 1712
- Joined: 16 Apr 2010
- Has thanked: 51 times
- Been thanked: 489 times
Re: MULTICHARTS 8.5 BETA 1 – WHAT’S NEW
We failed to reproduce any issues with LMAX data feed on our end. Please compare MC charts with the charts in LMAX Web Charts application (open the web page listed in QuoteManager -> Tools -. Data Sources -> LMAX -> API). If data in MC and LMAX Web Charts is different, please send us screenshots showing the difference. If data is the same, please contact LMAX with this issue.BTW, there are some problems with Lmax data, e.g. bad ticks on .../HUF pairs (see daily resolutions). Unreliable traded volume (spikes out of the blue when compared to tick volume).
Please send us MC logs and dump files (see links to the instructions below) collected after the issue has occurred but before restarting MultiCharts or come to our Live Chat before restarting MC Mon-Fri from 6:30 AM to 4 PM EST so we can collect all necessary information ourselves: http://messenger.providesupport.com/mes ... pport.htmlI would have shown the above on screenshots but MC 8.5 beta 1 crashed again on me today and is unresponsive. 7 crashes yesterday with Lmax data and 3 today (always occuring when I try to change resolution from 1 minute / 5 minutes / 20 minutes into daily resolution). yes, I know it is a beta, so I am not grumbling but pointing out fields for improvement.
https://www.multicharts.com/trading-sof ... harts_Logs
https://www.multicharts.com/trading-sof ... lect_Dumps
Also, describe the sequence of actions leading to the issue in details and send us your workspaces if possible.
Re: MULTICHARTS 8.5 BETA 1 – WHAT’S NEW
I gather these are issues on Lmax end. I post pictures in case someone from lmax is watching this thread. They might want to fix their issues.We failed to reproduce any issues with LMAX data feed on our end. Please compare MC charts with the charts in LMAX Web Charts application (open the web page listed in QuoteManager -> Tools -. Data Sources -> LMAX -> API). If data in MC and LMAX Web Charts is different, please send us screenshots showing the difference. If data is the same, please contact LMAX with this issue.
- Attachments
-
- spike traded volume.png
- (41.65 KiB) Downloaded 17854 times
-
- 1970.png
- (37.29 KiB) Downloaded 17802 times
-
- eurhuf.png
- (43.16 KiB) Downloaded 17759 times
-
- bad ticks.png
- (37.09 KiB) Downloaded 17767 times
Re: MULTICHARTS 8.5 BETA 1 – WHAT’S NEW
I've spent some time this weekend comparing the volume profiles to the volume profiles in SC and I am coming up with the same profiles, value areas and poc's, so that is awesome. I've previously compared SC with IRT and now feel Multicharts volume profiles are just as reliable.
I'm not a cumulative delta or footprint chart trader so I can't speak to the accuracy of that.
I would like to request the ability to plot the previous session vah, val and poc in the current session. I read above beta 2 will have the ability to plot the current sessions involving va and poc but wasn't sure if this will be included or not.
Overall I am very pleased with all this new stuff.
Re: MULTICHARTS 8.5 BETA 1 – WHAT’S NEW
Is there any way to access the Volume Profile, Volume Delta or Footprint data by code?
I would be most interested in being able to access the Volume Profile data even an indicator would be fine where I can get the values for the POC, VAH and VAL.
I would be most interested in being able to access the Volume Profile data even an indicator would be fine where I can get the values for the POC, VAH and VAL.
-
arnie
- Posts: 1594
- Joined: 11 Feb 2009
- Location: Portugal
- Has thanked: 481 times
- Been thanked: 514 times
Re: MULTICHARTS 8.5 BETA 1 – WHAT’S NEW
Beta 2 will not allow you to plot directly the previous day POC and VA into today's session but it will allow for you to plot "naked" POC's and VA's or, as some also calls it, extend it till future intersection. So if today you're trading inside yesterday's VA then you'll have those lines extended till they are broken to the upside or the downside.I would like to request the ability to plot the previous session vah, val and poc in the current session. I read above beta 2 will have the ability to plot the current sessions involving va and poc but wasn't sure if this will be included or not.
-
arnie
- Posts: 1594
- Joined: 11 Feb 2009
- Location: Portugal
- Has thanked: 481 times
- Been thanked: 514 times
Re: MULTICHARTS 8.5 BETA 1 – WHAT’S NEW
Here is an example how we can make longer term profile readings.
I have 132 days (calendar) loaded (all tick data available so far).
Last Friday we had an inside day. We have been accepting a rejection area but still have the area between 16.50 and 19.50 that traders have not yet able to surpass (ie. still being rejected)...
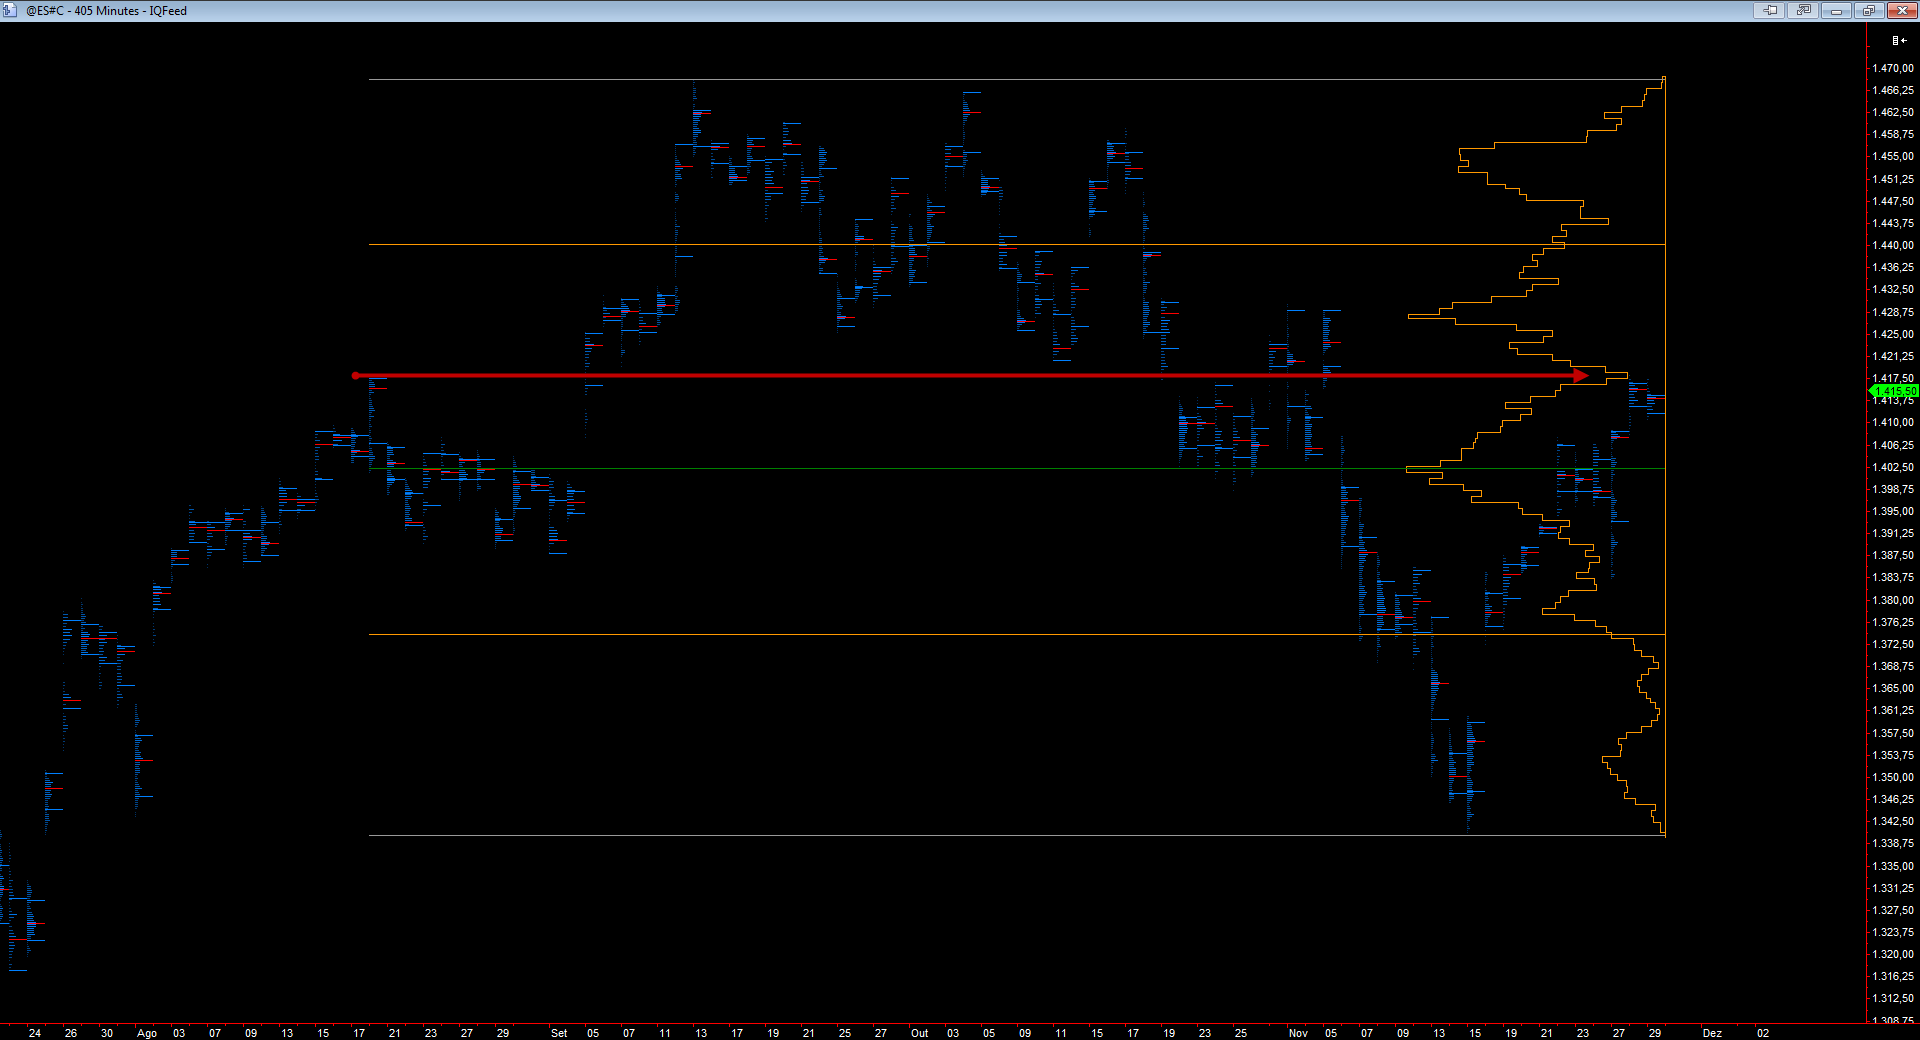
I have 132 days (calendar) loaded (all tick data available so far).
Last Friday we had an inside day. We have been accepting a rejection area but still have the area between 16.50 and 19.50 that traders have not yet able to surpass (ie. still being rejected)...
- Attachments
-
- ES_30-11.png
- (72.5 KiB) Downloaded 19905 times
-
arnie
- Posts: 1594
- Joined: 11 Feb 2009
- Location: Portugal
- Has thanked: 481 times
- Been thanked: 514 times
Re: MULTICHARTS 8.5 BETA 1 – WHAT’S NEW
The ability to draw a horizontal trendline using the Ctrl key is perfect but something is missing there.
If we decide to extend a bit more a trendline (to the left or to the right) that is already on the chart the Ctrl key does not work anymore.
Looking at the image below, while extending the trendline to the right, pressing the Ctrl key should make that trendline horizontal again and it doesn't.
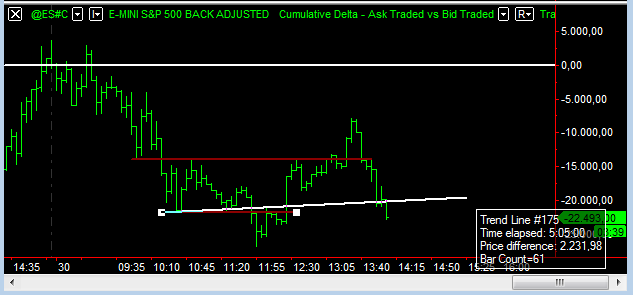
If we decide to extend a bit more a trendline (to the left or to the right) that is already on the chart the Ctrl key does not work anymore.
Looking at the image below, while extending the trendline to the right, pressing the Ctrl key should make that trendline horizontal again and it doesn't.
- Attachments
-
- trendline.png
- (14.33 KiB) Downloaded 19786 times
-
CrazyNasdaq
- Posts: 322
- Joined: 02 Sep 2009
- Location: ITALY
- Has thanked: 98 times
- Been thanked: 90 times
Re: MULTICHARTS 8.5 BETA 1 – WHAT’S NEW
Today in Cumulative delta charts on DAX future I've found bad ticks either in Upticks vs. Downticks or Ask vs. Bid.
Datafeed IQFeed, but same problem on Zenfire data.

Datafeed IQFeed, but same problem on Zenfire data.
-
Dave Masalov
- Posts: 1712
- Joined: 16 Apr 2010
- Has thanked: 51 times
- Been thanked: 489 times
Re: MULTICHARTS 8.5 BETA 1 – WHAT’S NEW
Hello CrazyNasdaq,Today in Cumulative delta charts on DAX future I've found bad ticks either in Upticks vs. Downticks or Ask vs. Bid.
Datafeed IQFeed, but same problem on Zenfire data.
Was this data collected in real-time or downloaded from historical servers? Have you tried to reload the charts (press Ctrl+R)
Please send us your workspace and a .qmd file with data for the symbol (see export instructions here: https://www.multicharts.com/trading-sof ... rting_Data)
Also, describe the sequence of actions leading to the issue in details.
Re: MULTICHARTS 8.5 BETA 1 – WHAT’S NEW
Won't pressing Ctrl R break the charts due to the averaging algorithm currently implemented? Of course when the update for IQfeed that was discussed a few posts back is implemented things should match exactly.
Was this data collected in real-time or downloaded from historical servers? Have you tried to reload the charts (press Ctrl+R)
Re: MULTICHARTS 8.5 BETA 1 – WHAT’S NEW
Jesh wrote
Is there any way to access the Volume Profile, Volume Delta or Footprint data by code?
I would be most interested in being able to access the Volume Profile data even an indicator would be fine where I can get the values for the POC, VAH and VAL.
What would be of great value would be to reference the delta or bid ask volumes within a range bar.
A 6 tick range bar would have 6 values say A-F with A holding the delta at the low of the bar and F the delta at the high.
Last edited by jl12 on 04 Dec 2012, edited 1 time in total.
-
Dave Masalov
- Posts: 1712
- Joined: 16 Apr 2010
- Has thanked: 51 times
- Been thanked: 489 times
Re: MULTICHARTS 8.5 BETA 1 – WHAT’S NEW
Hello Tresor,I gather these are issues on Lmax end. I post pictures in case someone from lmax is watching this thread. They might want to fix their issues.We failed to reproduce any issues with LMAX data feed on our end. Please compare MC charts with the charts in LMAX Web Charts application (open the web page listed in QuoteManager -> Tools -. Data Sources -> LMAX -> API). If data in MC and LMAX Web Charts is different, please send us screenshots showing the difference. If data is the same, please contact LMAX with this issue.
What web page is listed in QuoteManager -> Tools -> Data Sources -> LMAX -> API?
Have you compared MC charts with charts in LMAX Web Charts?
Re: MULTICHARTS 8.5 BETA 1 – WHAT’S NEW
it is a demo https://testapi.lmaxtrader.com
Hello Tresor,
What web page is listed in QuoteManager -> Tools -> Data Sources -> LMAX -> API?
Have you compared MC charts with charts in LMAX Web Charts?
I tried to log into their client log-in to check with their web charts, but the website keeps on rejecting my username and password. I do not know why.
Re: MULTICHARTS 8.5 BETA 1 – WHAT’S NEW
Okay, I logged in, but can't open ther web charts. It is probably because I did not apply for their web charts while requesting for demo.
It seems I can't make a comparison.
It seems I can't make a comparison.

Re: MULTICHARTS 8.5 BETA 1 – WHAT’S NEW
**** already resolved **** ... got the links ... thx
Download link for V8.5 Beta 1 brings me always back to the "trail" download section .... Is there any direct download link ?
Thx in advance.
Mike
Download link for V8.5 Beta 1 brings me always back to the "trail" download section .... Is there any direct download link ?
Thx in advance.
Mike
Re: MULTICHARTS 8.5 BETA 1 – WHAT’S NEW
Hello BMS,Arnie, Tks a lot,
yes we can obtain the same thing as with MD, Very nice, great!!
Attached the setting on a 5min (candlestick invisible +volume profile x bar as you said)
good trading
BMS
You have posted an excellent screenshot. I am not able to replicate the same into my charts.
Can you kindly provide me your workspace?
Thanks & Regards,
Mohi
-
CrazyNasdaq
- Posts: 322
- Joined: 02 Sep 2009
- Location: ITALY
- Has thanked: 98 times
- Been thanked: 90 times
Re: MULTICHARTS 8.5 BETA 1 – WHAT’S NEW
Sorry for the late response Dave, but I was not at home these days.Hello CrazyNasdaq,Today in Cumulative delta charts on DAX future I've found bad ticks either in Upticks vs. Downticks or Ask vs. Bid.
Datafeed IQFeed, but same problem on Zenfire data.
Was this data collected in real-time or downloaded from historical servers? Have you tried to reload the charts (press Ctrl+R)
Please send us your workspace and a .qmd file with data for the symbol (see export instructions here: https://www.multicharts.com/trading-sof ... rting_Data)
Also, describe the sequence of actions leading to the issue in details.
Today I've the same problem with CD on DAX future even for ASk vs. BID or UpTicks vs. DownTicks. The problem persists either with real time data or reload data (CTRL+R) and it appears for IQFeed data, Zenfire data and CQG data (see the creenshots). I use range bars (points bar) and I've noticed that this issue usually appears when there are frequency orders or when there are many orders/trades (over 100) in the same second, but not alway (see the picture of frequency).
I've tried to solve it deleteing data from quotemanager (ask, bid, trade field), but after the reload it appears again. The workspace is a simple chart with NO indicator but only Cumulative Delta chart with resolution at 10 points or 6 point per bar nothing else. The problem is on each datafeed at the same time today 09:40:38 am UTC+1 - Italian Time.
The problem does not exists in other charts type as Minute, contracts or seconds (see the last picture)
IQFeed charts

CQG & Zenfire charts

Frequency chart

Minute - contracts - seconds charts

-
Dave Masalov
- Posts: 1712
- Joined: 16 Apr 2010
- Has thanked: 51 times
- Been thanked: 489 times
Re: MULTICHARTS 8.5 BETA 1 – WHAT’S NEW
Hello CrazyNasdaq,Today I've the same problem with CD on DAX future even for ASk vs. BID or UpTicks vs. DownTicks.
The problem has been confirmed and added to our fix list. Thank you for reporting.
Re: MULTICHARTS 8.5 BETA 1 – WHAT’S NEW
Anyone else using 8.5 beta and TS 9.0 (8816) having disconnection problems usually at 16:05 EST? Either MC crashes and take TS with it or the DRM stops working? See attached. Thanks.
- Attachments
-
- MC_DRM2012-12-06_160630.gif
- (14.5 KiB) Downloaded 19759 times
-
Dave Masalov
- Posts: 1712
- Joined: 16 Apr 2010
- Has thanked: 51 times
- Been thanked: 489 times
Re: MULTICHARTS 8.5 BETA 1 – WHAT’S NEW
tekram,Anyone else using 8.5 beta and TS 9.0 (8816) having disconnection problems usually at 16:05 EST? Either MC crashes and take TS with it or the DRM stops working? See attached. Thanks.
Please send us MC logs and dump files (see links to the instructions below) collected after the issue has occurred but before restarting MultiCharts or come to our Live Chat before restarting MC Mon-Fri from 6:30 AM to 4 PM EST so we can collect all necessary information ourselves: http://messenger.providesupport.com/mes ... pport.html
https://www.multicharts.com/trading-sof ... harts_Logs
https://www.multicharts.com/trading-sof ... lect_Dumps
Re: MULTICHARTS 8.5 BETA 1 – WHAT’S NEW
That would be pretty useful. MC must maintain an array of volume @ price too do the profile stuff. It might be a good idea to expose that programmatically too.Is there any way to access the Volume Profile, Volume Delta or Footprint data by code?
I would be most interested in being able to access the Volume Profile data even an indicator would be fine where I can get the values for the POC, VAH and VAL.
Re: MULTICHARTS 8.5 BETA 1 – WHAT’S NEW
Pardon me if this is in/or planned already but a constant delta chart type is very useful. Essentially you start a new bar when delta changes by nnn amount. Similar to a constant volume or range chart except the new bar is plotted when delta changes by a predefined amount. like a range chart this can be up or down from the bar open.
-
Laurentius
- Posts: 90
- Joined: 01 Jan 2011
- Location: Europe
- Has thanked: 138 times
- Been thanked: 36 times
Re: MULTICHARTS 8.5 BETA 1 – WHAT’S NEW
Agree with Arnie here. To get the full usefulness of this feature Ctrl have to be working after the lines are set also. Not meant as being ungrateful, but the way it is now is a kind of amputated.The ability to draw a horizontal trendline using the Ctrl key is perfect but something is missing there.
If we decide to extend a bit more a trendline (to the left or to the right) that is already on the chart the Ctrl key does not work anymore.
Looking at the image below, while extending the trendline to the right, pressing the Ctrl key should make that trendline horizontal again and it doesn't.
Laurentius
Edit: Adding link for pm feature request: https://www.multicharts.com/pm/viewissu ... no=MC-1180
Last edited by Laurentius on 08 Dec 2012, edited 1 time in total.
-
arnie
- Posts: 1594
- Joined: 11 Feb 2009
- Location: Portugal
- Has thanked: 481 times
- Been thanked: 514 times
Re: MULTICHARTS 8.5 BETA 1 – WHAT’S NEW
I found something that needs your attention.
First, I simply love the new session keyboard shortcut. We can now easily toggle between sessions. For volume profile visualization this is awesome.
But there's a problem thought with the way you set this. The default session it's a no brainer, it's the one set for each symbol in QM but the 24/7 is a bit tricky. The idea here was to toggle between the regular trading hours and the full futures trading day.
The image on the left shows the 24/7 chart and on the right the full trading day which has 23h:15m. So you basically cannot use the 24/7 template for futures since it will not plot the entire trading day since it runs between 00:00 and 23:59. We could solve this easily by changing the 24/7 template but then it would be impossible to use it with another symbol that has different trading hours.
My idea would be to add a menu (similar to the one I add to the image) where we can choose the session template to use for the second session or even better, add that menu to both sessions allowing users to choose the ones they want to toggle.
Is this possible?
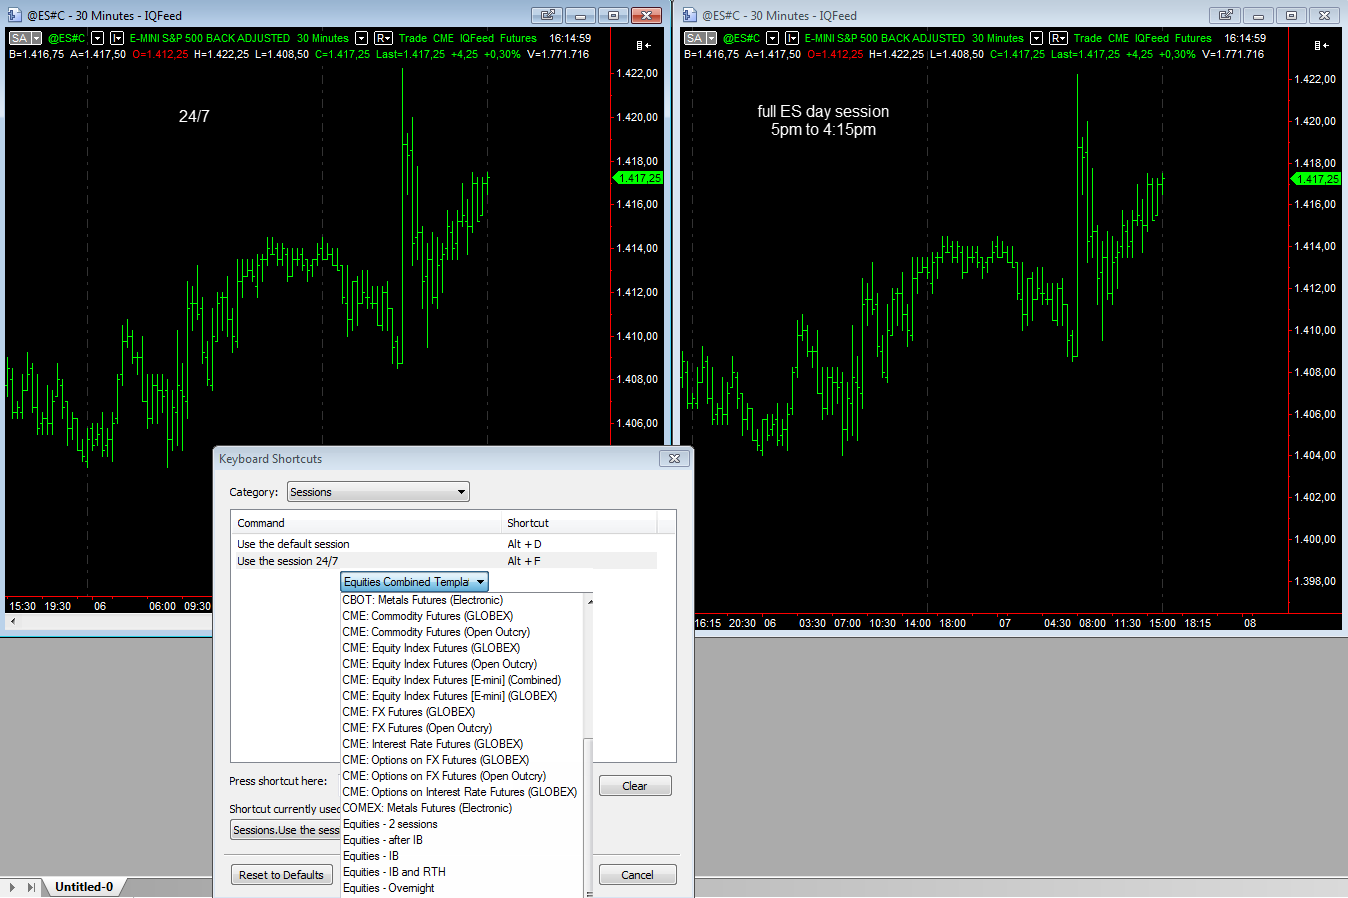
Regards,
Fernando
First, I simply love the new session keyboard shortcut. We can now easily toggle between sessions. For volume profile visualization this is awesome.
But there's a problem thought with the way you set this. The default session it's a no brainer, it's the one set for each symbol in QM but the 24/7 is a bit tricky. The idea here was to toggle between the regular trading hours and the full futures trading day.
The image on the left shows the 24/7 chart and on the right the full trading day which has 23h:15m. So you basically cannot use the 24/7 template for futures since it will not plot the entire trading day since it runs between 00:00 and 23:59. We could solve this easily by changing the 24/7 template but then it would be impossible to use it with another symbol that has different trading hours.
My idea would be to add a menu (similar to the one I add to the image) where we can choose the session template to use for the second session or even better, add that menu to both sessions allowing users to choose the ones they want to toggle.
Is this possible?
Regards,
Fernando
- Attachments
-
- keyboard session shortcut.png
- (84.11 KiB) Downloaded 19568 times
-
arnie
- Posts: 1594
- Joined: 11 Feb 2009
- Location: Portugal
- Has thanked: 481 times
- Been thanked: 514 times
Re: MULTICHARTS 8.5 BETA 1 – WHAT’S NEW
Is there a way to clean this workspace list?
Many were just tests, ideas that are no longer useful and I'd like to remove them from here.
Many were just tests, ideas that are no longer useful and I'd like to remove them from here.
- Attachments
-
- list.png
- (95.61 KiB) Downloaded 19503 times
-
TJ
- Posts: 7752
- Joined: 29 Aug 2006
- Location: Global Citizen
- Has thanked: 1034 times
- Been thanked: 2228 times
Re: MULTICHARTS 8.5 BETA 1 – WHAT’S NEW
highlight it can press the [Delete] key.Is there a way to clean this workspace list?
Many were just tests, ideas that are no longer useful and I'd like to remove them from here.
-
TJ
- Posts: 7752
- Joined: 29 Aug 2006
- Location: Global Citizen
- Has thanked: 1034 times
- Been thanked: 2228 times
Re: MULTICHARTS 8.5 BETA 1 – WHAT’S NEW
Ok, you have the list of the most recent wsp.Sorry TJ, doesn't work.highlight it can press the [Delete] key.
You have to open some new wsp, the old list will be pushed down and disappeared.
-
arnie
- Posts: 1594
- Joined: 11 Feb 2009
- Location: Portugal
- Has thanked: 481 times
- Been thanked: 514 times
Re: MULTICHARTS 8.5 BETA 1 – WHAT’S NEW
There's 16 different workspaces on that list.Ok, you have the list of the most recent wsp.
You have to open some new wsp, the old list will be pushed down and disappeared.
I would need to open 16 new workspaces to remove those.
I was hoping we could clean these through some line in the windows registry.
-
JoshM

- Posts: 2195
- Joined: 20 May 2011
- Location: The Netherlands
- Has thanked: 1544 times
- Been thanked: 1565 times
- Contact:
Re: MULTICHARTS 8.5 BETA 1 – WHAT’S NEW
Keep in mind that LMAX demo data is provided by a market bot, and therefore their demo feed prices are different than their live prices. For more information, this is documented in the LMAX thread on BigMike.BTW, there are some problems with Lmax data, e.g. bad ticks on .../HUF pairs (see daily resolutions). Unreliable traded volume (spikes out of the blue when compared to tick volume).
I would have shown the above on screenshots but MC 8.5 beta 1 crashed again on me today and is unresponsive. 7 crashes yesterday with Lmax data and 3 today (always occuring when I try to change resolution from 1 minute / 5 minutes / 20 minutes into daily resolution). yes, I know it is a beta, so I am not grumbling but pointing out fields for improvement.
Such a thing has already been requested with 29 votes currently: MC-504 - Automatically reload the chart after a lost (internet) connection is restored. Can MC comment on when we can expect this highly wished for feature?But I do agree that MC should be able to collect all missing data automatically, specially when the connection is lost.
When data connection is lost, due to internet loss, MC should have the capability to detect that connection loss, warn us and as soon the data connection is ON again, it should be able to download all missing data during that period.
This limitation has already come up multiple times. Are there any plans to plot DOMs using IQFeed data?Unfortunately, there is no way to get bid/ask volume from IQFeed. You can get bid/ask volume DOM data using Dom_asksize and Dom_bidsize keywords if your broker provides DOM data.
Re: MULTICHARTS 8.5 BETA 1 – WHAT’S NEW
I am having a recurrent problem with MC hanging on establishing connection it happens regardless of whether i am opening an iq or ib chart. When I close MC processes more often than not remain open.
At 20 gig has my database become too big, if i delete contracts will it reduce the size or is a clean up necessary.
At 20 gig has my database become too big, if i delete contracts will it reduce the size or is a clean up necessary.
-
Dave Masalov
- Posts: 1712
- Joined: 16 Apr 2010
- Has thanked: 51 times
- Been thanked: 489 times
Re: MULTICHARTS 8.5 BETA 1 – WHAT’S NEW
This feature has been added to our to-do list and should be available in MC 8.5 Release.Agree with Arnie here. To get the full usefulness of this feature Ctrl have to be working after the lines are set also. Not meant as being ungrateful, but the way it is now is a kind of amputated.The ability to draw a horizontal trendline using the Ctrl key is perfect but something is missing there.
If we decide to extend a bit more a trendline (to the left or to the right) that is already on the chart the Ctrl key does not work anymore.
Looking at the image below, while extending the trendline to the right, pressing the Ctrl key should make that trendline horizontal again and it doesn't.
Laurentius
Edit: Adding link for pm feature request: https://www.multicharts.com/pm/viewissu ... no=MC-1180
Re: MULTICHARTS 8.5 BETA 1 – WHAT’S NEW
Hi guys, forgive me if this is in already (I don't plan on testing until beta 2). It would be good (arguably 'necessary') to have a parameter for the percentage of the distribution used to calculate the value area. Some might want 68% others 95% or even 99%. This corresponds to 1 2 or 3 standard deviations but people might want 1.5 or any other numbers (just as they might with bollinger bands for example).
As a footnote and (technically speaking) there us a lot of nonsense spoken on this subject. To be able to assume 68% is 1 standard deviation the data must be normally distributed, financial data series are not. Having said that it is still useful to be able to define how much data the value area encompasses.
As a footnote and (technically speaking) there us a lot of nonsense spoken on this subject. To be able to assume 68% is 1 standard deviation the data must be normally distributed, financial data series are not. Having said that it is still useful to be able to define how much data the value area encompasses.
-
sptrader
- Posts: 742
- Joined: 09 Apr 2010
- Location: Texas
- Has thanked: 483 times
- Been thanked: 274 times
- Contact:
Re: MULTICHARTS 8.5 BETA 1 – WHAT’S NEW
************************************************************************Hi guys, forgive me if this is in already (I don't plan on testing until beta 2). It would be good (arguably 'necessary') to have a parameter for the percentage of the distribution used to calculate the value area. Some might want 68% others 95% or even 99%. This corresponds to 1 2 or 3 standard deviations but people might want 1.5 or any other numbers (just as they might with bollinger bands for example).
As a footnote and (technically speaking) there us a lot of nonsense spoken on this subject. To be able to assume 68% is 1 standard deviation the data must be normally distributed, financial data series are not. Having said that it is still useful to be able to define how much data the value area encompasses.
The value area percentage is fully adjustable in beta1, it's set to 70% by default..colors are adjustable for marking the value area and POC, You can even make it partially "transparent", to make price bars easier to see.
It's really cool and beautifully done..Kudos to the MC team !
-
Dave Masalov
- Posts: 1712
- Joined: 16 Apr 2010
- Has thanked: 51 times
- Been thanked: 489 times
Re: MULTICHARTS 8.5 BETA 1 – WHAT’S NEW
Please send us MC logs collected after the issue has occurred but before restarting MultiCharts as well as dump files of MC processes not ended after you close MC (see links to the instructions below) or come to our Live Chat before restarting MC Mon-Fri from 6:30 AM to 4 PM EST so we can collect all necessary information ourselves: http://messenger.providesupport.com/mes ... pport.htmlI am having a recurrent problem with MC hanging on establishing connection it happens regardless of whether i am opening an iq or ib chart. When I close MC processes more often than not remain open.
https://www.multicharts.com/trading-sof ... harts_Logs
https://www.multicharts.com/trading-sof ... lect_Dumps
As for reducing data base size, please see the following MC Wiki article: https://www.multicharts.com/trading-sof ... abase_SizeAt 20 gig has my database become too big, if i delete contracts will it reduce the size or is a clean up necessary.
-
Dave Masalov
- Posts: 1712
- Joined: 16 Apr 2010
- Has thanked: 51 times
- Been thanked: 489 times
Re: MULTICHARTS 8.5 BETA 1 – WHAT’S NEW
arnie,Is there a way to clean this workspace list?
Many were just tests, ideas that are no longer useful and I'd like to remove them from here.
You should delete the following registry key:
32 bit
HKEY_CURRENT_USER\Software\TS Support\MultiCharts\Recent Document List
64 bit
HKEY_CURRENT_USER\Software\TS Support\MultiCharts64\Recent Document List
Re: MULTICHARTS 8.5 BETA 1 – WHAT’S NEW
Great I might have to just dive in with beta 1.************************************************************************Hi guys, forgive me if this is in already (I don't plan on testing until beta 2). It would be good (arguably 'necessary') to have a parameter for the percentage of the distribution used to calculate the value area. Some might want 68% others 95% or even 99%. This corresponds to 1 2 or 3 standard deviations but people might want 1.5 or any other numbers (just as they might with bollinger bands for example).
As a footnote and (technically speaking) there us a lot of nonsense spoken on this subject. To be able to assume 68% is 1 standard deviation the data must be normally distributed, financial data series are not. Having said that it is still useful to be able to define how much data the value area encompasses.
The value area percentage is fully adjustable in beta1, it's set to 70% by default..colors are adjustable for marking the value area and POC, You can even make it partially "transparent", to make price bars easier to see.
It's really cool and beautifully done..Kudos to the MC team !
Is beta 2 expected this year? Just wondering.
Re: MULTICHARTS 8.5 BETA 1 – WHAT’S NEW
In the MC 8.5 beta 1 (or future) implementation of TPO, how often is the indicator updated and is there an option to NOT update TPO until end of bar? [Thinking of minimizing CPU cycles].
Re: MULTICHARTS 8.5 BETA 1 – WHAT’S NEW
If i decrease the bar space the delta is displayed sometimes as
" bid
x
ask"
instead of
" bid x ask".
For me it is very confusing to see the bid above the ask, is there a way to change this behaviour to display at least the ask above the bid or better to prevent that three rows instead of one are displayed?
" bid
x
ask"
instead of
" bid x ask".
For me it is very confusing to see the bid above the ask, is there a way to change this behaviour to display at least the ask above the bid or better to prevent that three rows instead of one are displayed?
- Attachments
-
- Clipboard01.jpg
- (191.32 KiB) Downloaded 17760 times
-
ABC
- Posts: 723
- Joined: 16 Dec 2006
- Location: www.abctradinggroup.com
- Has thanked: 125 times
- Been thanked: 410 times
- Contact:
Re: MULTICHARTS 8.5 BETA 1 – WHAT’S NEW
When I open a plain Kagi chart, MC is pulling in bid and ask data from IQFeed besides just the trade data. I made sure that Volume Profile or Delta studies are not active. Is this intended to work this way, as if I recall correctly this is new behavior?
Thank you,
ABC
Thank you,
ABC
-
Dave Masalov
- Posts: 1712
- Joined: 16 Apr 2010
- Has thanked: 51 times
- Been thanked: 489 times
Re: MULTICHARTS 8.5 BETA 1 – WHAT’S NEW
Hello ABC,When I open a plain Kagi chart, MC is pulling in bid and ask data from IQFeed besides just the trade data. I made sure that Volume Profile or Delta studies are not active. Is this intended to work this way, as if I recall correctly this is new behavior?
Thank you,
ABC
This issue has been cnfiremd and fixed. The fix will be available in MC 8.5 beta 2. Thank you for reporting.
-
ABC
- Posts: 723
- Joined: 16 Dec 2006
- Location: www.abctradinggroup.com
- Has thanked: 125 times
- Been thanked: 410 times
- Contact:
Re: MULTICHARTS 8.5 BETA 1 – WHAT’S NEW
Thank you, Dave. I just noticed that it happens for Renko, too. But I guess the fix will cover this too.Hello ABC,When I open a plain Kagi chart, MC is pulling in bid and ask data from IQFeed besides just the trade data. I made sure that Volume Profile or Delta studies are not active. Is this intended to work this way, as if I recall correctly this is new behavior?
Thank you,
ABC
This issue has been cnfiremd and fixed. The fix will be available in MC 8.5 beta 2. Thank you for reporting.
Thank you,
ABC
-
Dave Masalov
- Posts: 1712
- Joined: 16 Apr 2010
- Has thanked: 51 times
- Been thanked: 489 times
Re: MULTICHARTS 8.5 BETA 1 – WHAT’S NEW
Yes, this will be fixed too.I just noticed that it happens for Renko, too. But I guess the fix will cover this too.
Re: MULTICHARTS 8.5 BETA 1 – WHAT’S NEW
There is a scaling issue when trading contracts like Copper which trade in .0005 increments.
Setting the scale at 10,000 hasn't been a problem in the past.
For volume profile the colour blocks only form 1/5 of the price leaving no space for the Bid ask numbers to be displayed.
Setting the scale at 10,000 hasn't been a problem in the past.
For volume profile the colour blocks only form 1/5 of the price leaving no space for the Bid ask numbers to be displayed.
Re: MULTICHARTS 8.5 BETA 1 – WHAT’S NEW
When plotting delta every x bars there is an issue with displaying the text for the latest bars.
In the attached example the profile is plotted every 18 bars for 20 second increments however the Bid ask numbers are not displayed until a significant number of the 18 bars have formed.
As long as there is a margin set to the right screen space is available.
In the attached example the profile is plotted every 18 bars for 20 second increments however the Bid ask numbers are not displayed until a significant number of the 18 bars have formed.
As long as there is a margin set to the right screen space is available.
-
Dave Masalov
- Posts: 1712
- Joined: 16 Apr 2010
- Has thanked: 51 times
- Been thanked: 489 times
Re: MULTICHARTS 8.5 BETA 1 – WHAT’S NEW
Hello jl12,There is a scaling issue when trading contracts like Copper which trade in .0005 increments.
Setting the scale at 10,000 hasn't been a problem in the past.
For volume profile the colour blocks only form 1/5 of the price leaving no space for the Bid ask numbers to be displayed.
Please configure the settings as follows:
PriceScale = 1/10000 and MinMovement = 5.
-
Dave Masalov
- Posts: 1712
- Joined: 16 Apr 2010
- Has thanked: 51 times
- Been thanked: 489 times
Re: MULTICHARTS 8.5 BETA 1 – WHAT’S NEW
jl12,When plotting delta every x bars there is an issue with displaying the text for the latest bars.
In the attached example the profile is plotted every 18 bars for 20 second increments however the Bid ask numbers are not displayed until a significant number of the 18 bars have formed.
As long as there is a margin set to the right screen space is available.
The test didn't fit in the last profile, so it was not displayed. If you zoom in price or time scale, the text will appear.
-
Dave Masalov
- Posts: 1712
- Joined: 16 Apr 2010
- Has thanked: 51 times
- Been thanked: 489 times
Re: MULTICHARTS 8.5 BETA 1 – WHAT’S NEW
Hello SP,If i decrease the bar space the delta is displayed sometimes as
" bid
x
ask"
instead of
" bid x ask".
For me it is very confusing to see the bid above the ask, is there a way to change this behaviour to display at least the ask above the bid or better to prevent that three rows instead of one are displayed?
Thank you for your suggestion, it has been forwarded to the developers and will be considered for future implementation. This feature will be optimized in the nest Beta.
Re: MULTICHARTS 8.5 BETA 1 – WHAT’S NEW
One problem occured with FormatTime, i dont think i had it with the previous version 8.1.
On minute charts the line
if LastBarOnChart_s then print (FormatTime ("HH:mm:ss",el_timetodatetime_s (time_s)));
doesnt return seconds. I always get xx:xx:00 rounded to end of the bar time. On tick and volume charts the print is correct with 12:04:14 .
On minute charts the line
if LastBarOnChart_s then print (FormatTime ("HH:mm:ss",el_timetodatetime_s (time_s)));
doesnt return seconds. I always get xx:xx:00 rounded to end of the bar time. On tick and volume charts the print is correct with 12:04:14 .
-
Dave Masalov
- Posts: 1712
- Joined: 16 Apr 2010
- Has thanked: 51 times
- Been thanked: 489 times
Re: MULTICHARTS 8.5 BETA 1 – WHAT’S NEW
Hello SP,One problem occured with FormatTime, i dont think i had it with the previous version 8.1.
On minute charts the line
if LastBarOnChart_s then print (FormatTime ("HH:mm:ss",el_timetodatetime_s (time_s)));
doesnt return seconds. I always get xx:xx:00 rounded to end of the bar time. On tick and volume charts the print is correct with 12:04:14 .
This is normal behavior. Time_s returns a numerical value indicating the closing time, including seconds, of the current bar. For minute charts closing time of the bar is always rounded to the minute.
Re: MULTICHARTS 8.5 BETA 1 – WHAT’S NEW
Whilst it is possible to over zoom for the first bars of a sequence then unzoom, doing this every few minutes is not ideal, the latest Bid* Ask should be viewable by default.jl12 wrote:
When plotting delta every x bars there is an issue with displaying the text for the latest bars.
In the attached example the profile is plotted every 18 bars for 20 second increments however the Bid ask numbers are not displayed until a significant number of the 18 bars have formed.
As long as there is a margin set to the right screen space is available.
Attachment:
bidaskvalues.png
Attachment:
volpsetting.png
jl12,
The test didn't fit in the last profile, so it was not displayed. If you zoom in price or time scale, the text will appear.
-
swz168

- Posts: 120
- Joined: 30 Sep 2010
- Location: Germany
- Has thanked: 47 times
- Been thanked: 32 times
Re: MULTICHARTS 8.5 BETA 1 – WHAT’S NEW
"Optimisation settings should remain after editing the study": https://www.multicharts.com/pm/viewissu ... no=MC-1207
Hope you change the current behavior, because it costs a lot of time if you do a lot of editing a strategy and optimizing.
Hope you change the current behavior, because it costs a lot of time if you do a lot of editing a strategy and optimizing.
-
Dave Masalov
- Posts: 1712
- Joined: 16 Apr 2010
- Has thanked: 51 times
- Been thanked: 489 times
Re: MULTICHARTS 8.5 BETA 1 – WHAT’S NEW
Hello swz168,"Optimisation settings should remain after editing the study": https://www.multicharts.com/pm/viewissu ... no=MC-1207
Hope you change the current behavior, because it costs a lot of time if you do a lot of editing a strategy and optimizing.
This should be implemented in MC 8.5 Release.
-
Dave Masalov
- Posts: 1712
- Joined: 16 Apr 2010
- Has thanked: 51 times
- Been thanked: 489 times
Re: MULTICHARTS 8.5 BETA 1 – WHAT’S NEW
jl12,Whilst it is possible to over zoom for the first bars of a sequence then unzoom, doing this every few minutes is not ideal, the latest Bid* Ask should be viewable by default.jl12 wrote:
When plotting delta every x bars there is an issue with displaying the text for the latest bars.
In the attached example the profile is plotted every 18 bars for 20 second increments however the Bid ask numbers are not displayed until a significant number of the 18 bars have formed.
As long as there is a margin set to the right screen space is available.
Attachment:
bidaskvalues.png
Attachment:
volpsetting.png
jl12,
The test didn't fit in the last profile, so it was not displayed. If you zoom in price or time scale, the text will appear.
Your suggestion has been forwarded to the developers and will be considered for implementation.
Re: MULTICHARTS 8.5 BETA 1 – WHAT’S NEW
As IQ feed Bid/Ask import is limited to 120 days, for those of us with access to additional data it would be useful to import from ascii in Last, Vol, Bid, Ask type format similar to the example below.
31/01/2012 07:01:03 138.81 1263 138.81 138.82
31/01/2012 07:01:03 138.82 44 138.81 138.82
31/01/2012 07:01:03 138.83 63 138.81 138.82
31/01/2012 07:01:03 138.81 1263 138.81 138.82
31/01/2012 07:01:03 138.82 44 138.81 138.82
31/01/2012 07:01:03 138.83 63 138.81 138.82
Last edited by jl12 on 29 Dec 2012, edited 1 time in total.