Yes, it's the correct .pln file.
Sorry, but I'm not seeing the label issue on MultiCharts .NET64 Version 9.0 Release (Build 10362). I did see something else that I couldn't explain with the code (and that seems to be a MultiCharts issue), so I contacted MultiCharts Support on that.
It might take a while before I can continue working on it though, since I also have 2 other open issues with Support from 4 weeks ago that I haven't received an update yet on.
Oops. Ma bad.
I compiled the wrong file

When you get the time and the reply from support, there are a couple of things that should be addressed.
Why not also aggregate yesterdays high and low and todays high and low into single inputs like you did with overnight and 24h?
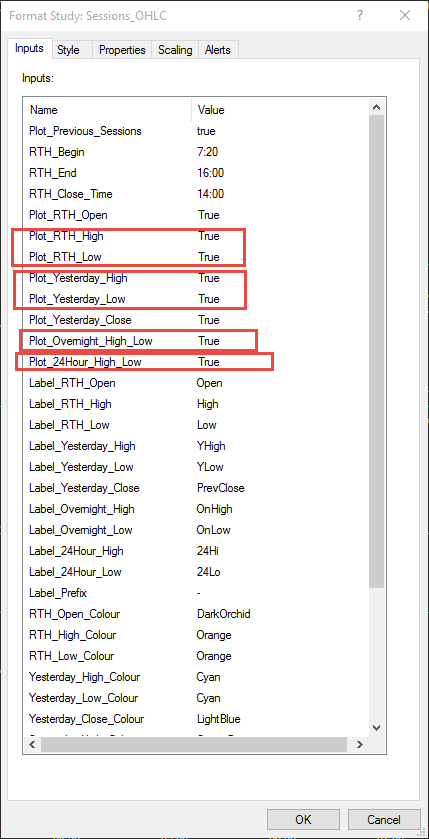
Now regarding the RTH high and low, there's a problem with the reading and plotting.
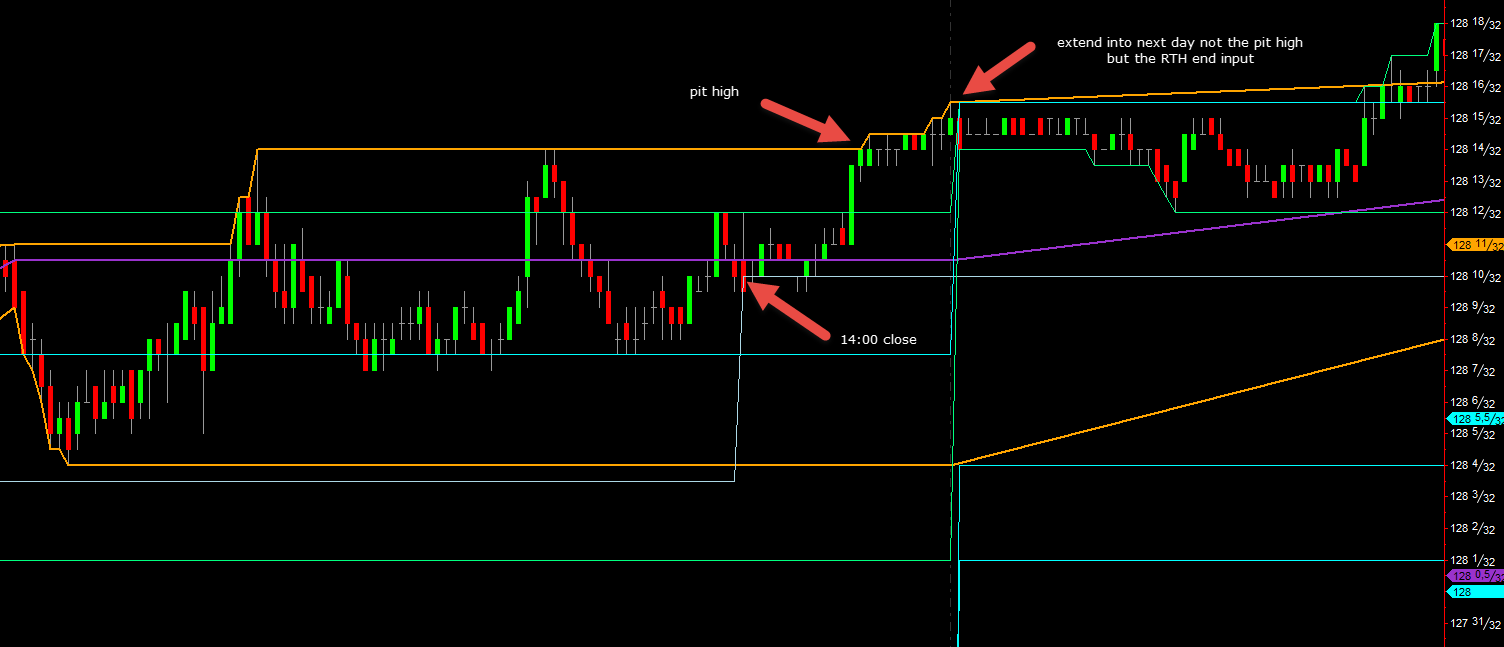
The chart is the 10 year note.
Overnight (ETH - electronic trading hours) starts at 17:00 and ends at 7:20. Pit session (RTH - regular trading hours) starts at 7:20 and ends at 14:00. Between 14:00 and 16:00 it's another ETH session.
The RTH high and low at the moment is plotting between 7:20 and 16:00. The 7:20 marks the start of the pit session which is correct but the 16:00 is marking the end of the trading day and not the end of the pit session which is given by the third time input you added to mark the RTH (pit) close.
So you can see in the chart that after the pit close at 14:00, the 10 year made new high for the day, above the pit high. The pit high line after 14:00 should not continue to update, it should extend that last high till the end of the day at 16:00. You can also see that at the next day what was extended was the 24h high which was also the pit high according to the study but in fact, although the 24h high is OK at 15.5, the pit high was at 14, not 15.5.
I hope I'm making myself understood. When we get too technical things can become quite confuse.
It's just a problem of time reading.
Here's another thing I've just noticed, it seems the study starts the reading 1 bar before the pit open.
Using the 10 year as example, if the pit opens at 7:20, the time stamp of the first bar on a 5 minute chart is 7:25 but the study is starting the reading at 7:20 bar which can give a wrong open price and also a wrong high and low.
Since the bar time stamp in MC is the bar close the study needs to use the first bar after the RTH_Begin time to start the RTH(pit) high, low and open calculations.
