MultiCharts
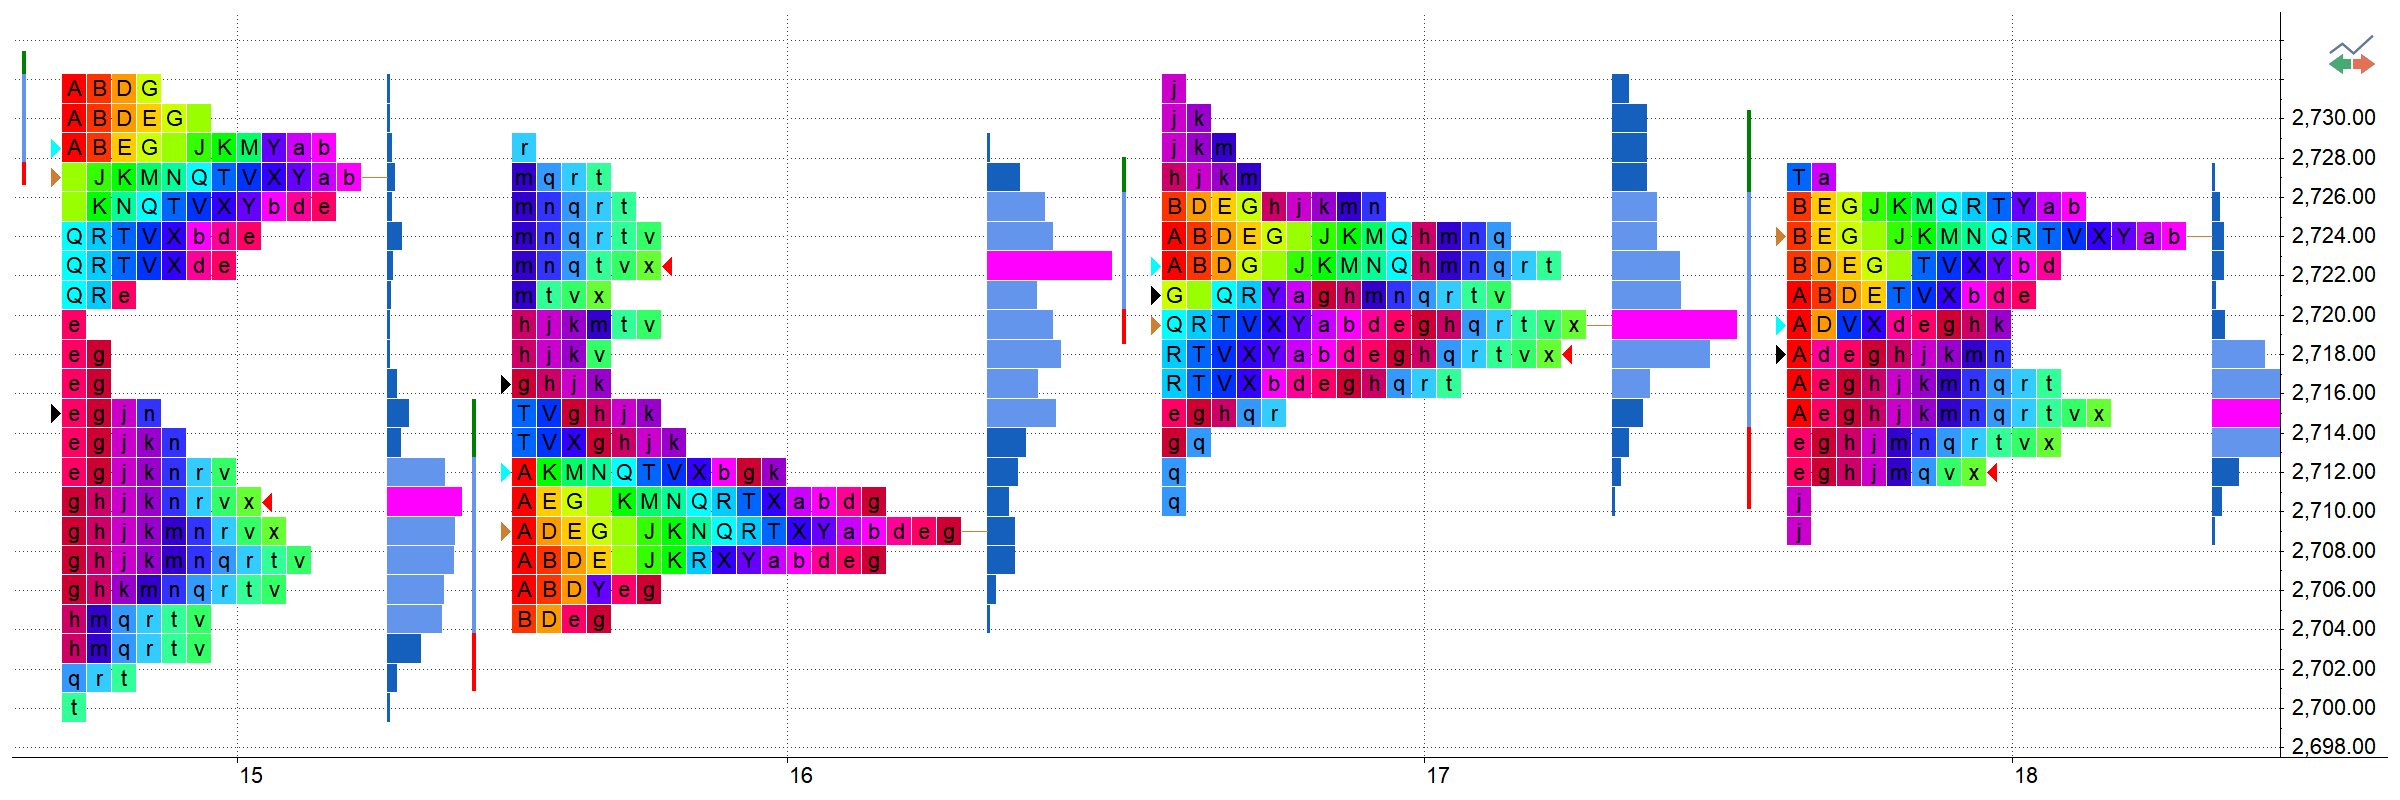
Time Price Opportunity
Our TPO chart is designed to be flexible with easy to use customization options that allows for flawless switching from any other TPO tool with which you may be familiar. TPO identifies where the most trading is occurring at any given time. It analyzes the amount of trading activity based on time for each level the market traded at for any given time frame.
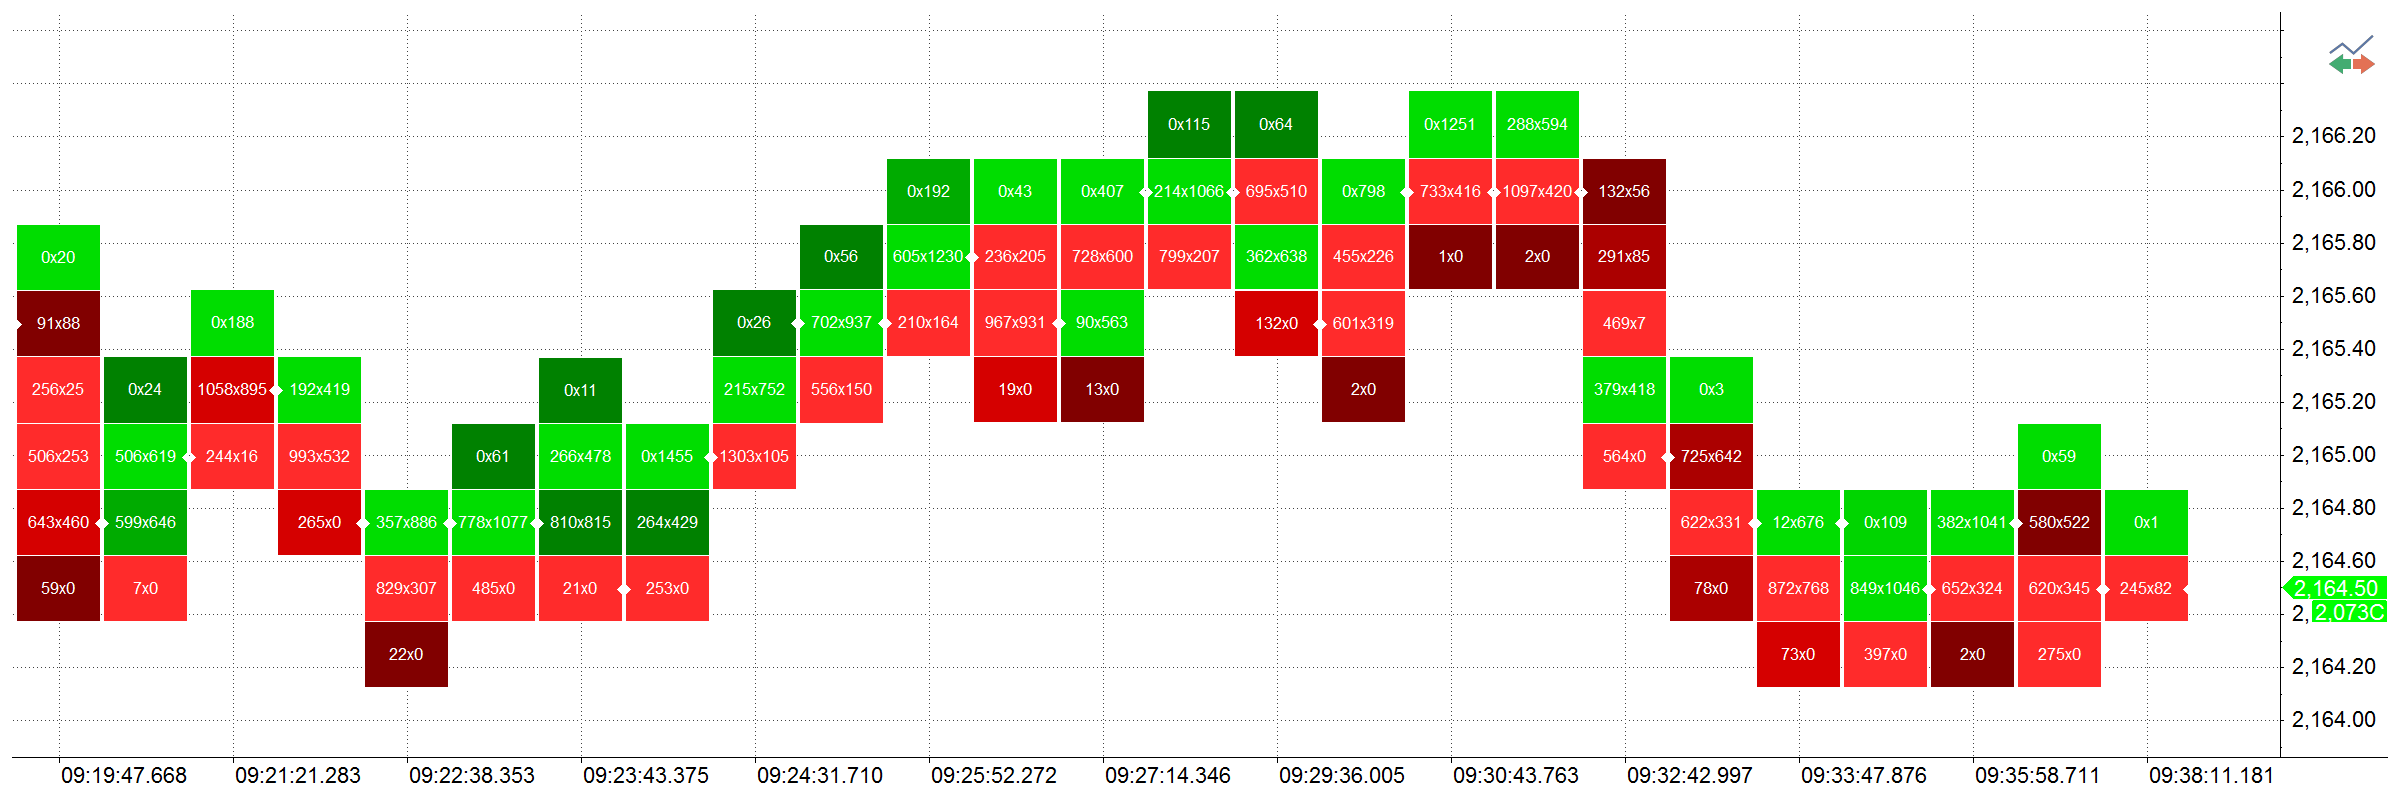
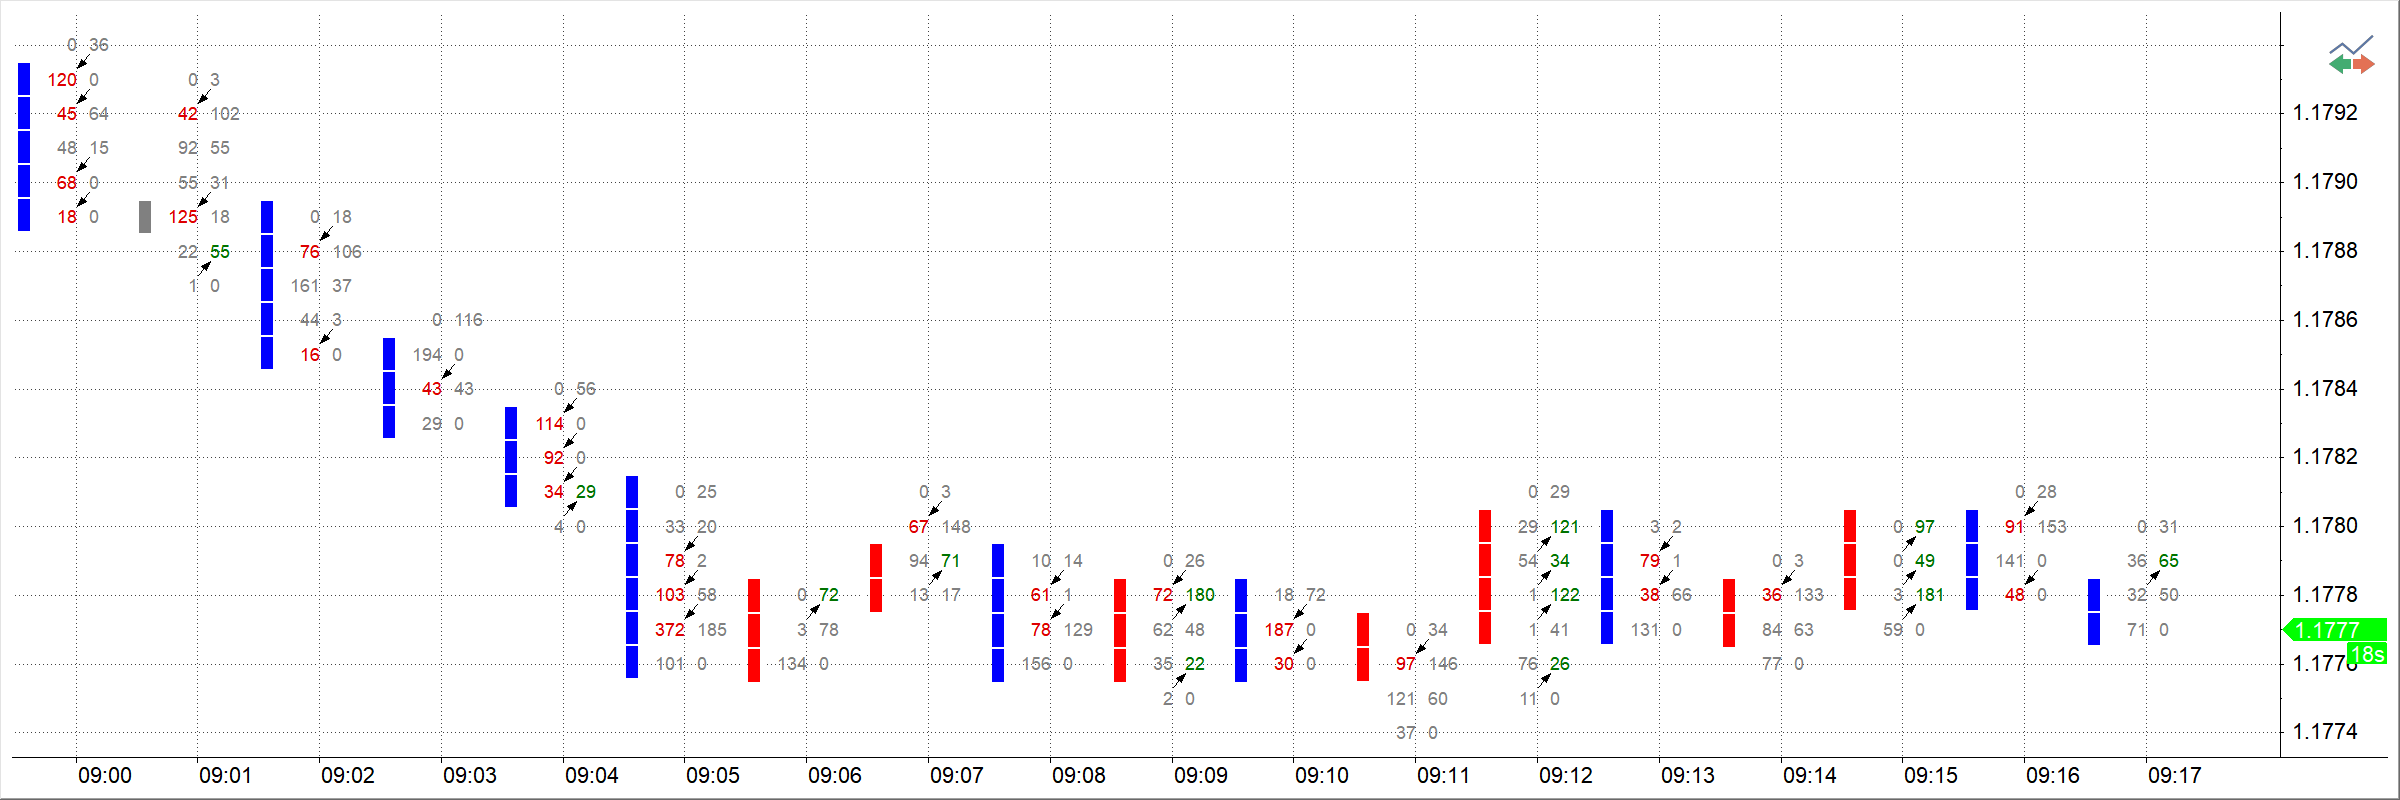
Volume Delta
This chart lets you see how many trades were done at ask and bid on each price level within a bar. The bars look like boxes with appropriate numbers displayed within them. There are two calculation methods: “Ask Traded vs Bid Traded” and “Up Ticks vs Down Ticks”.
MultiCharts
MultiCharts
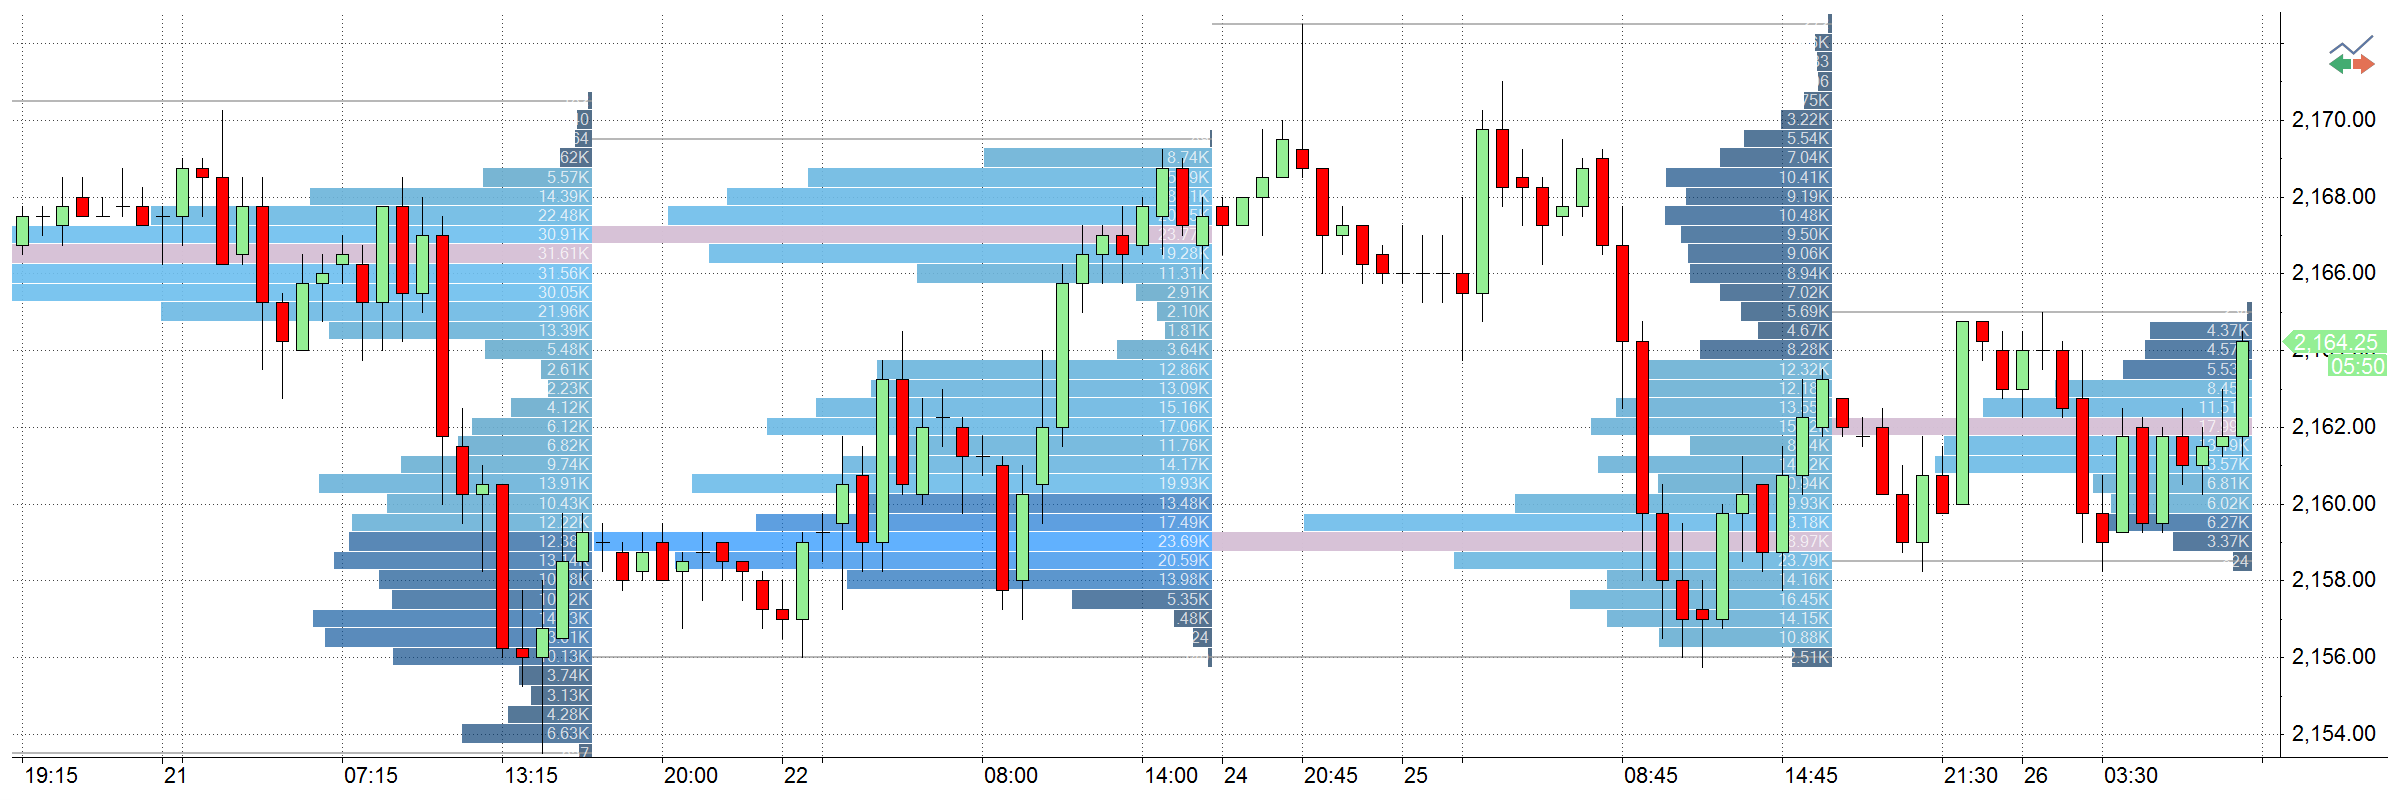
Volume Profile
Volume Profile tracks trading activity volume across different price levels and varying time length.
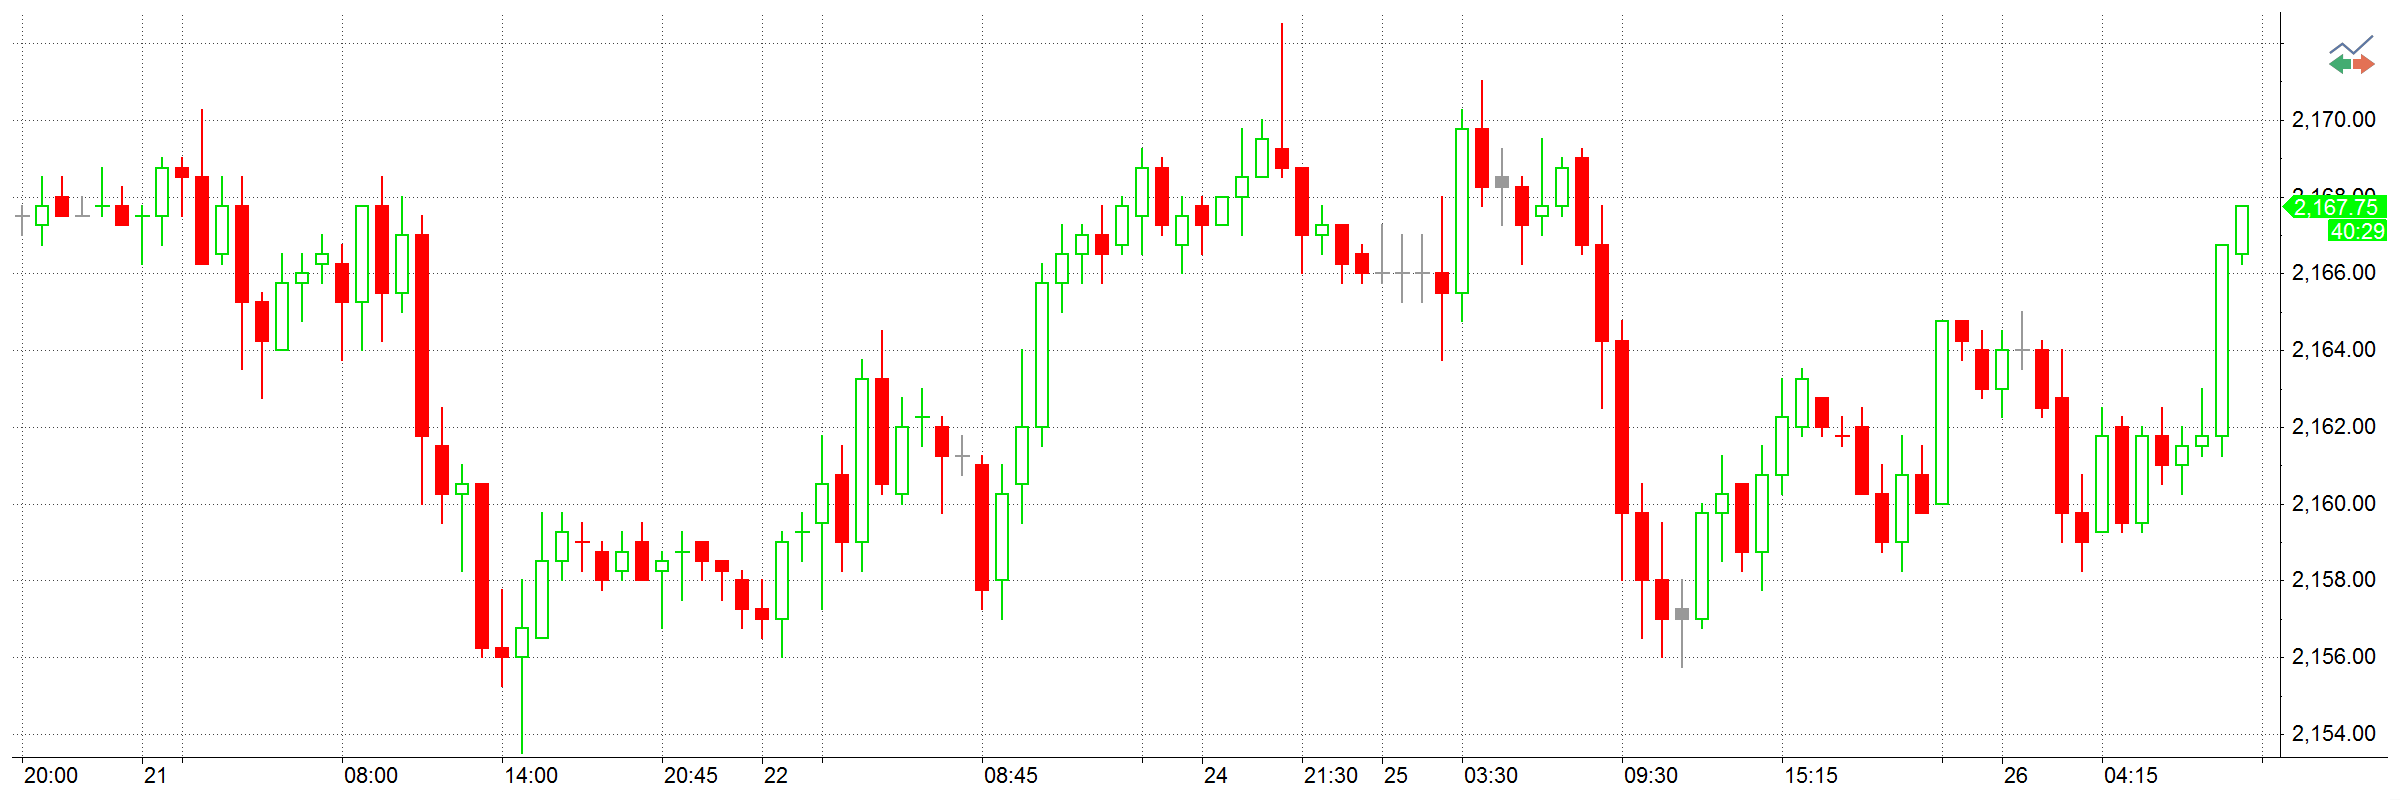
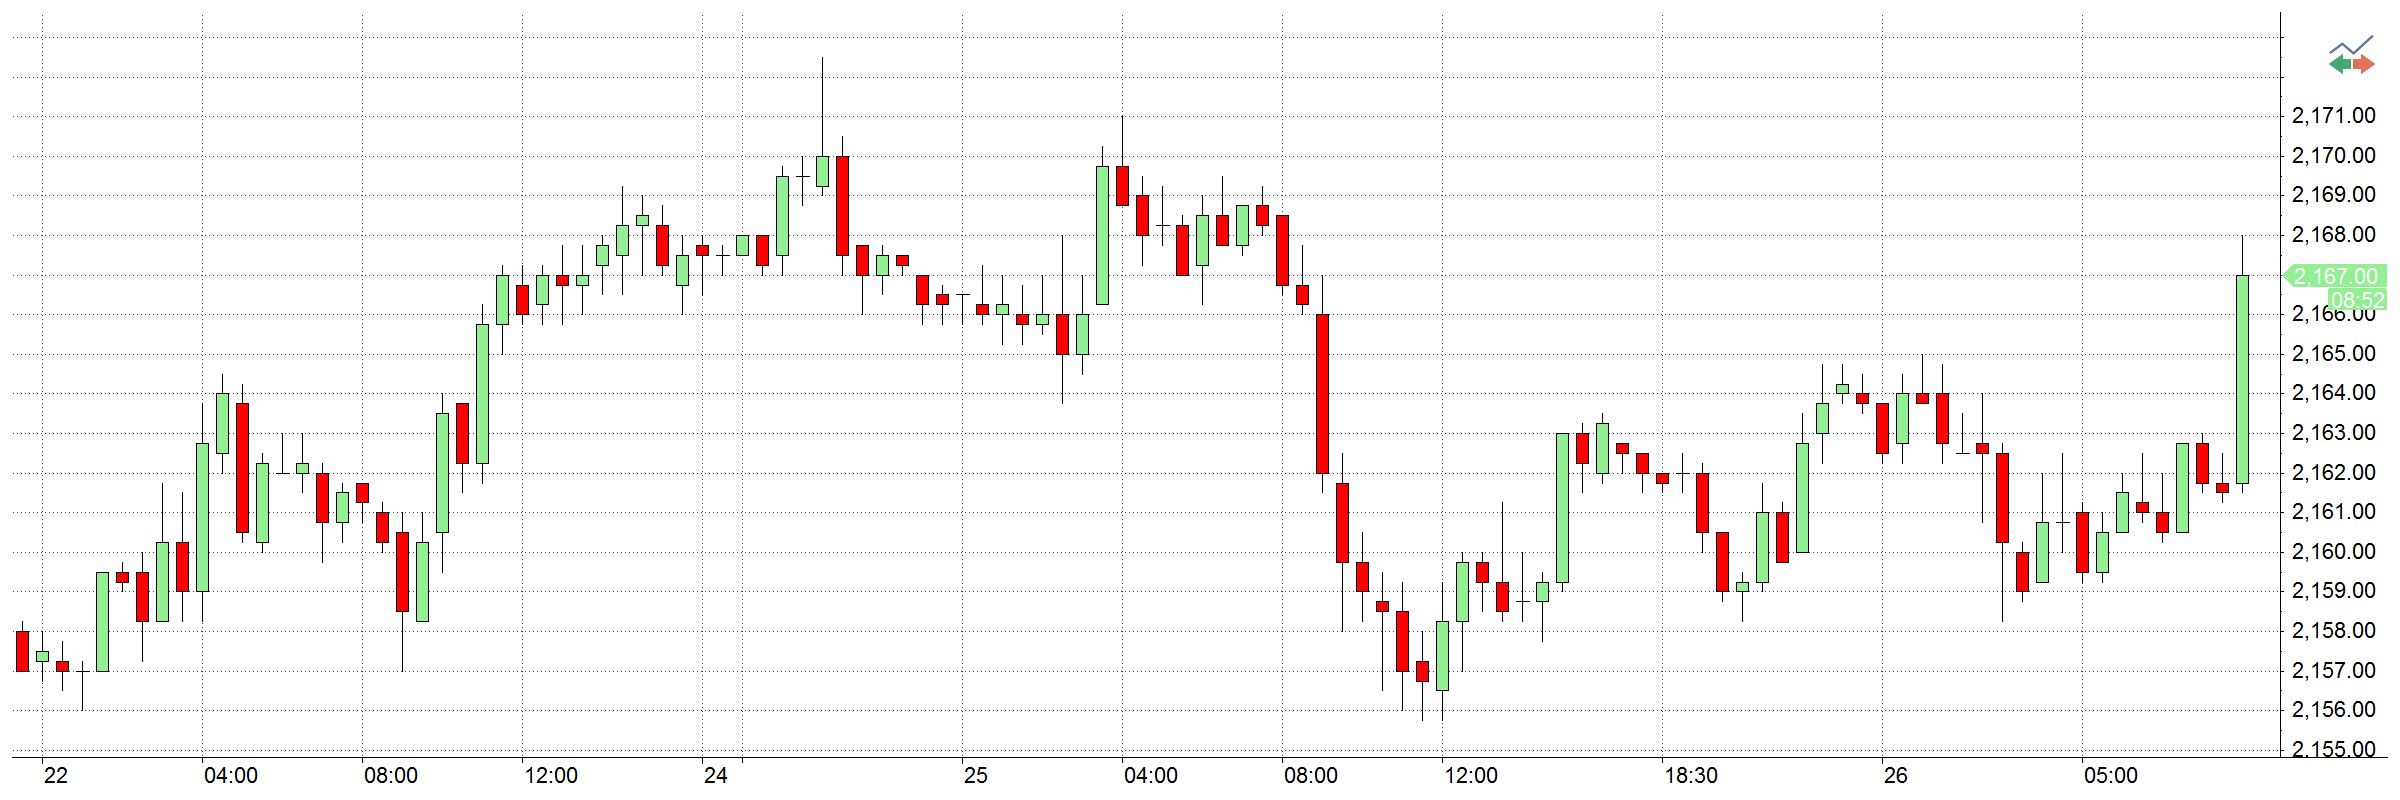
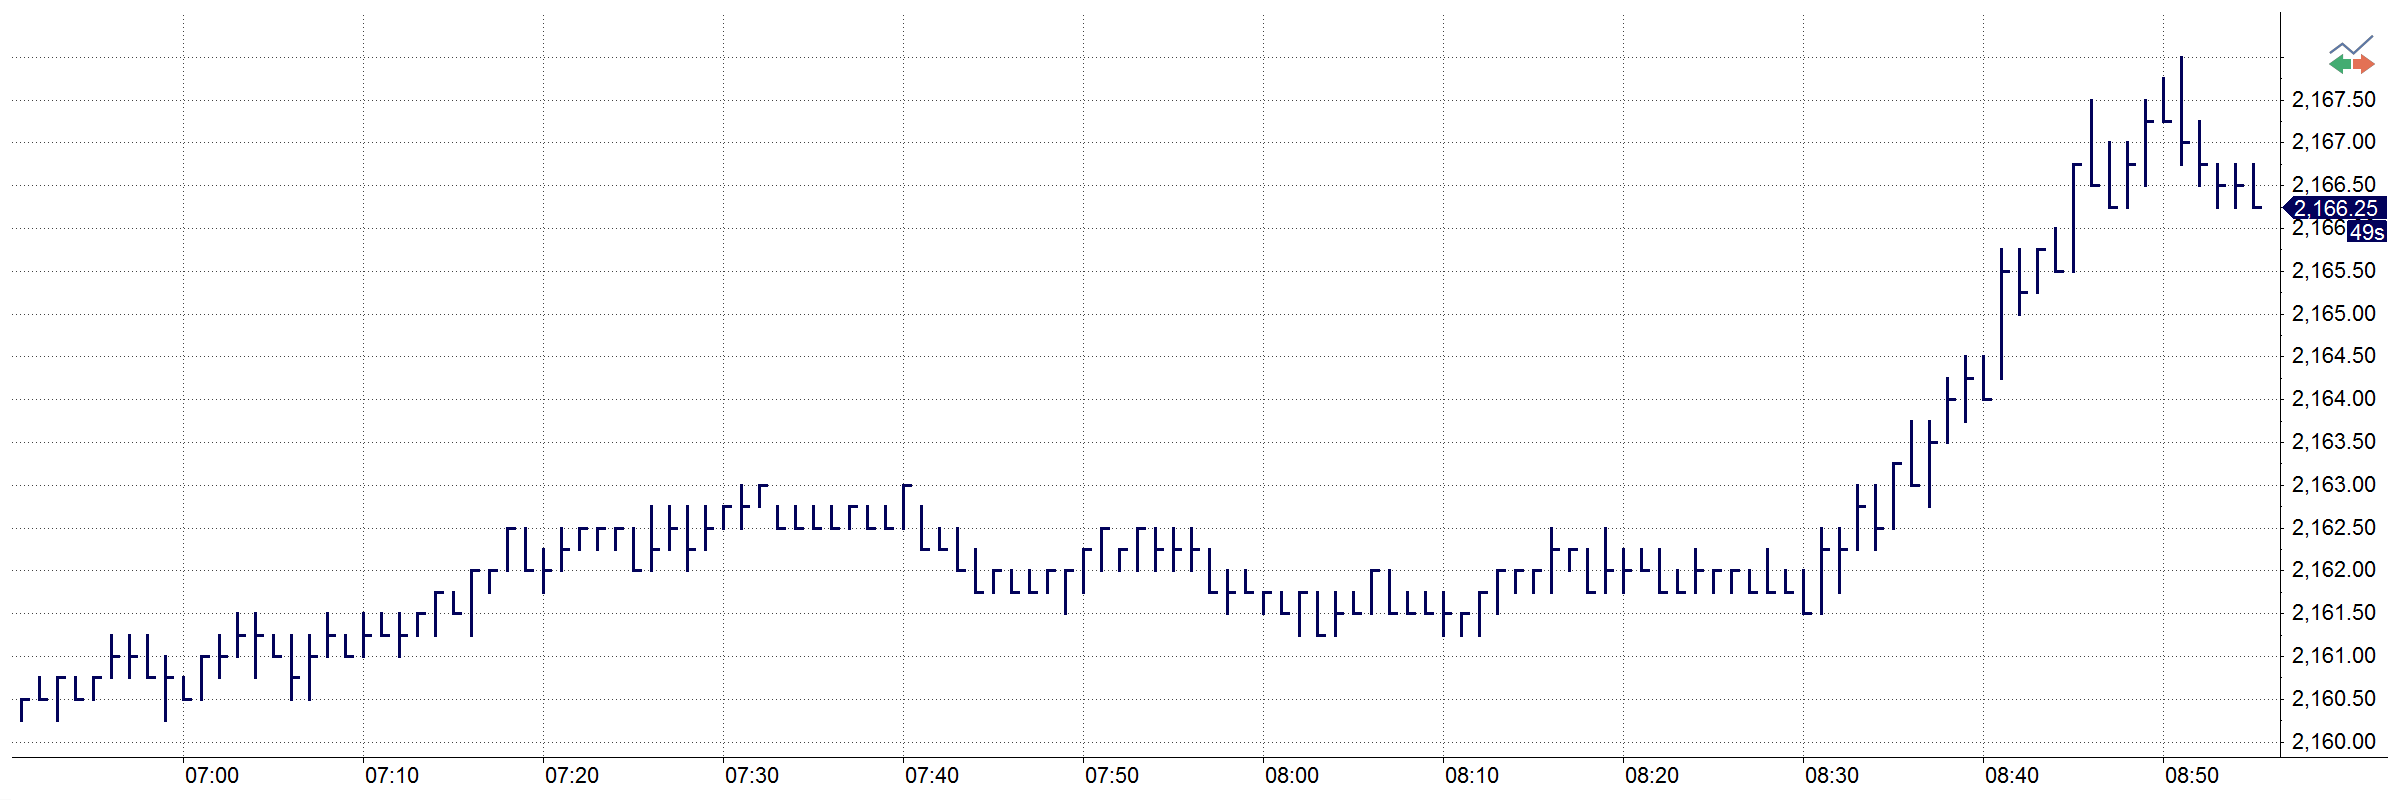
OHLC
This chart type is the most common way to display data for analysis. Open, high, low, and close prices are shown for the time increment represented by the bar. Bar charts can be time-based, tick-based, or volume-based.
MultiCharts
MultiCharts
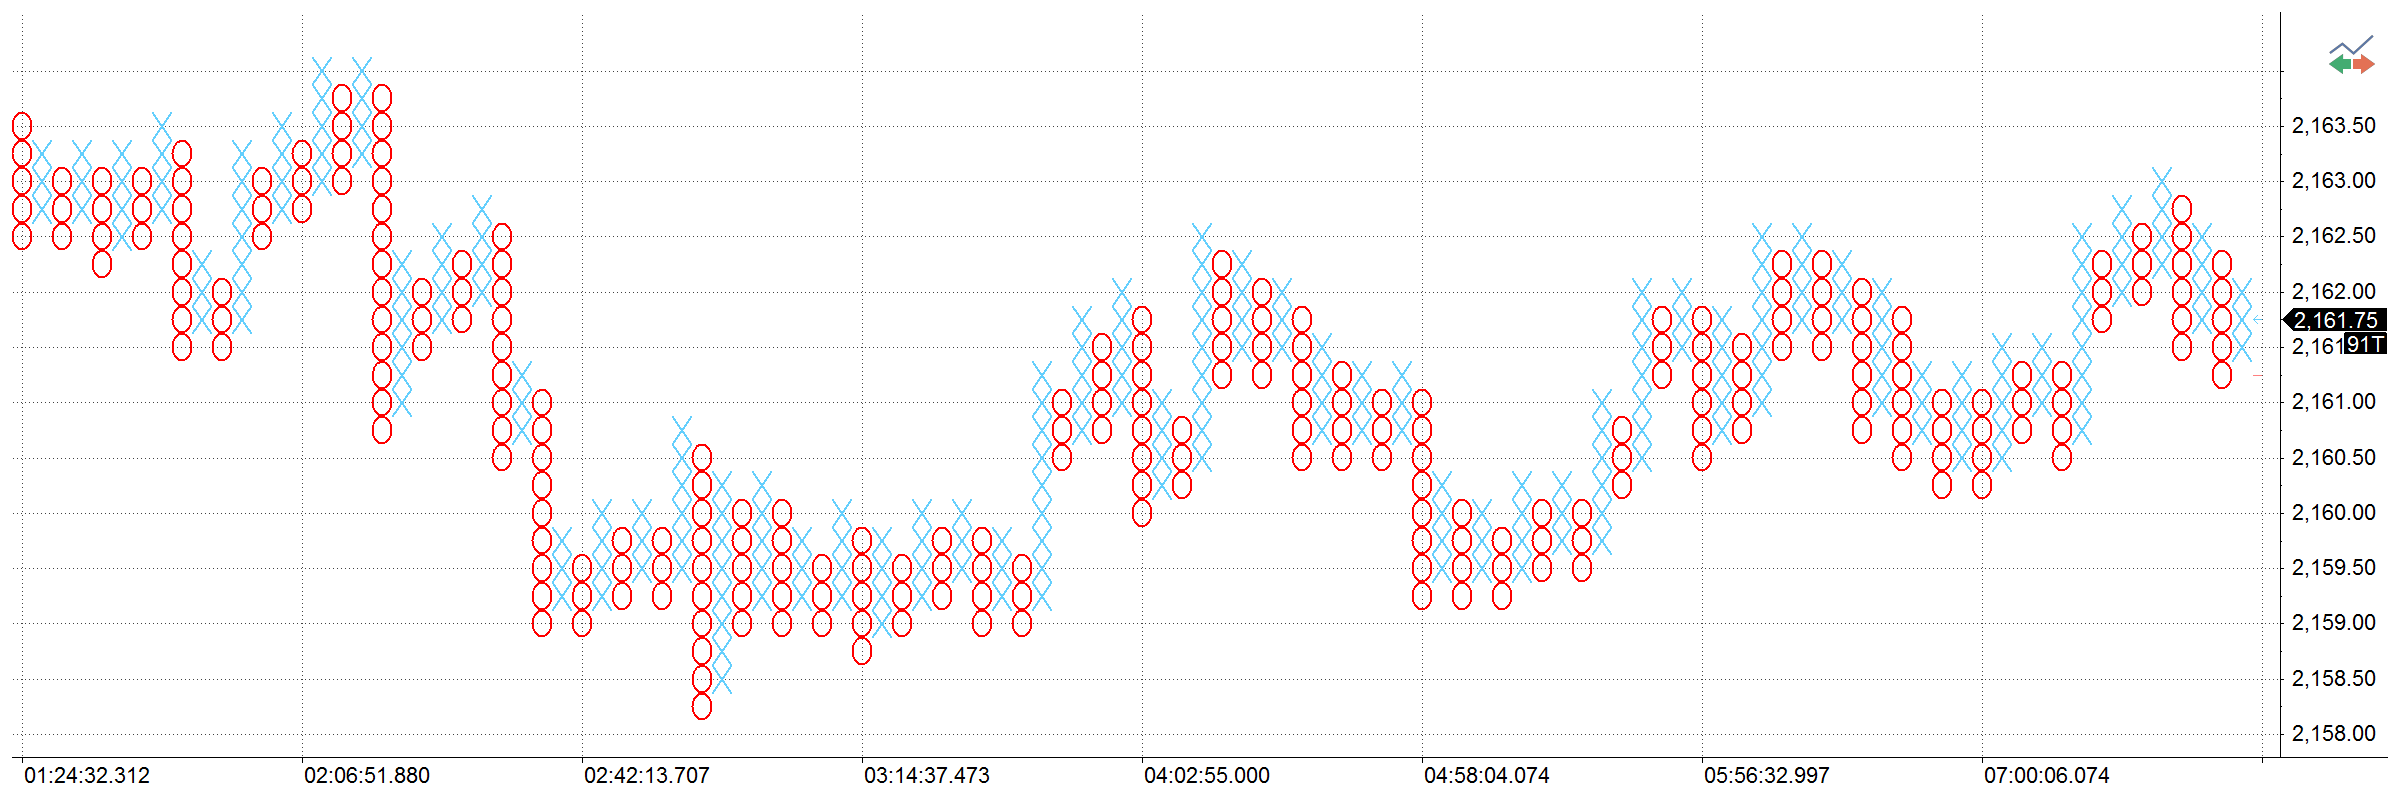
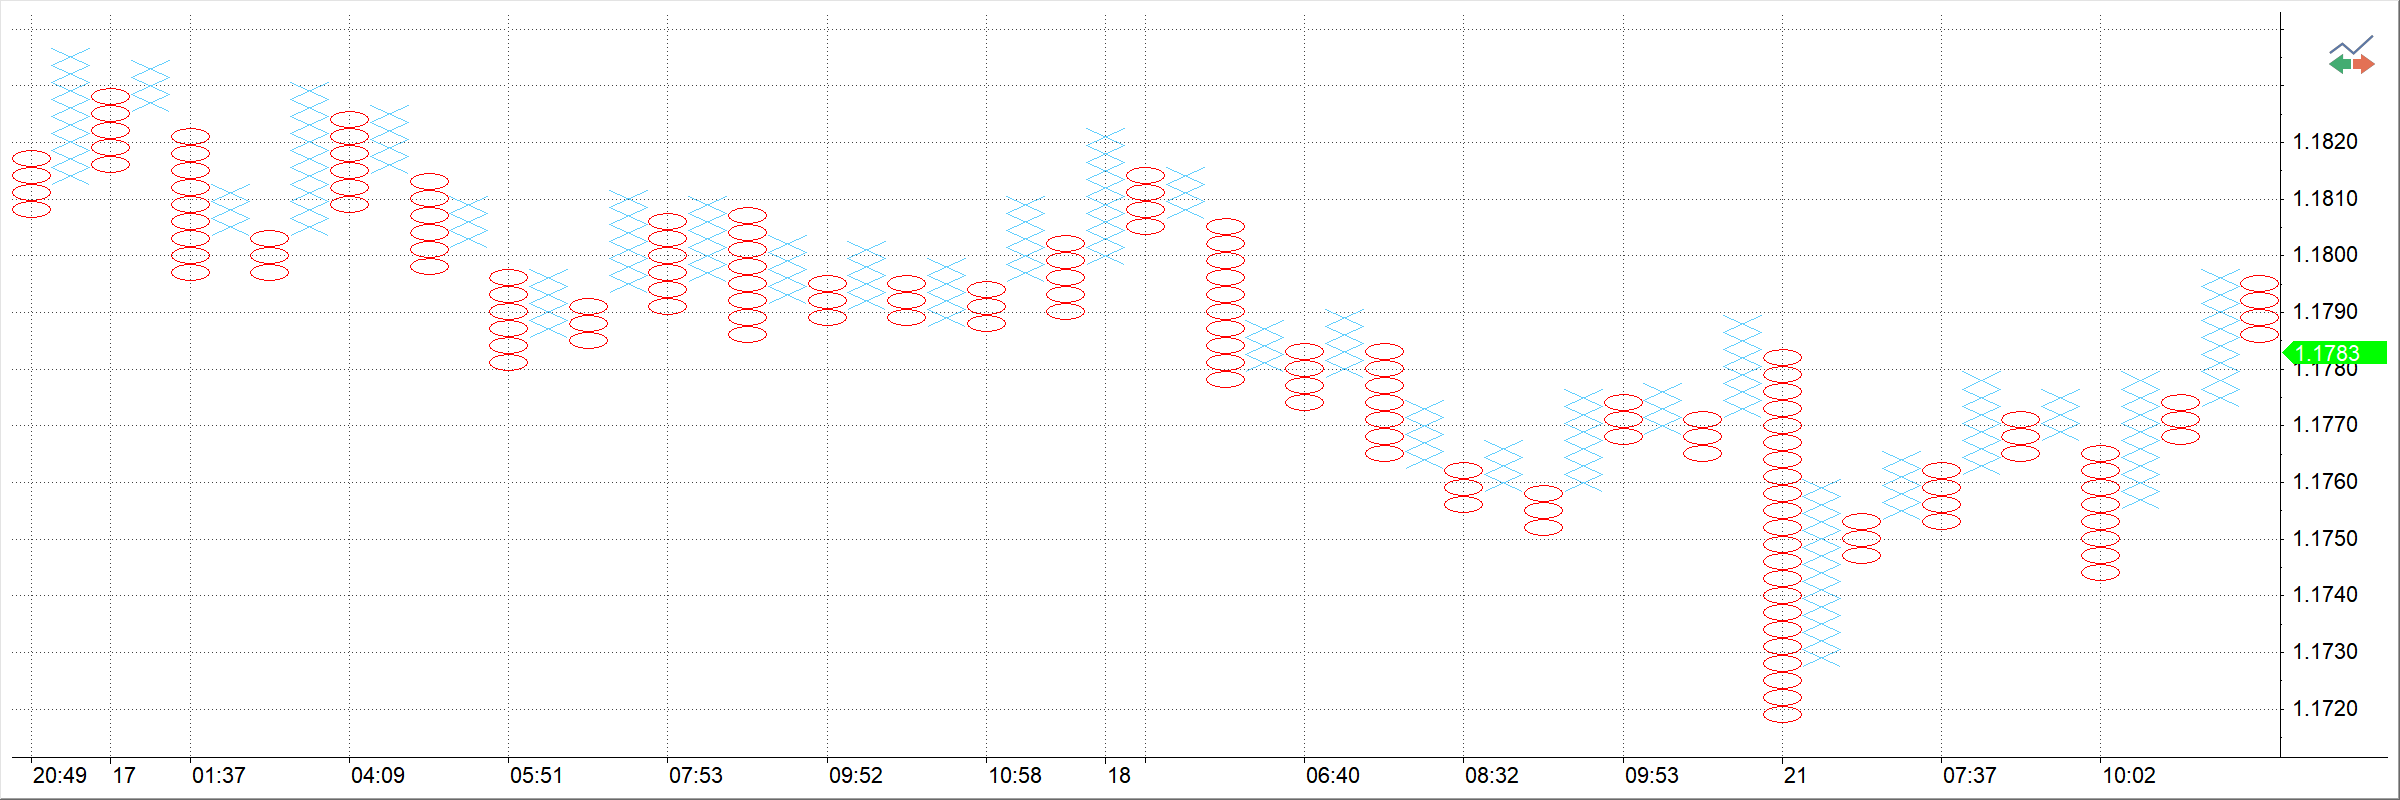
Point and Figure
This chart type only plots price movements, without taking time into consideration. A column of X’s is plotted as the price rises — and O’s as the price drops.
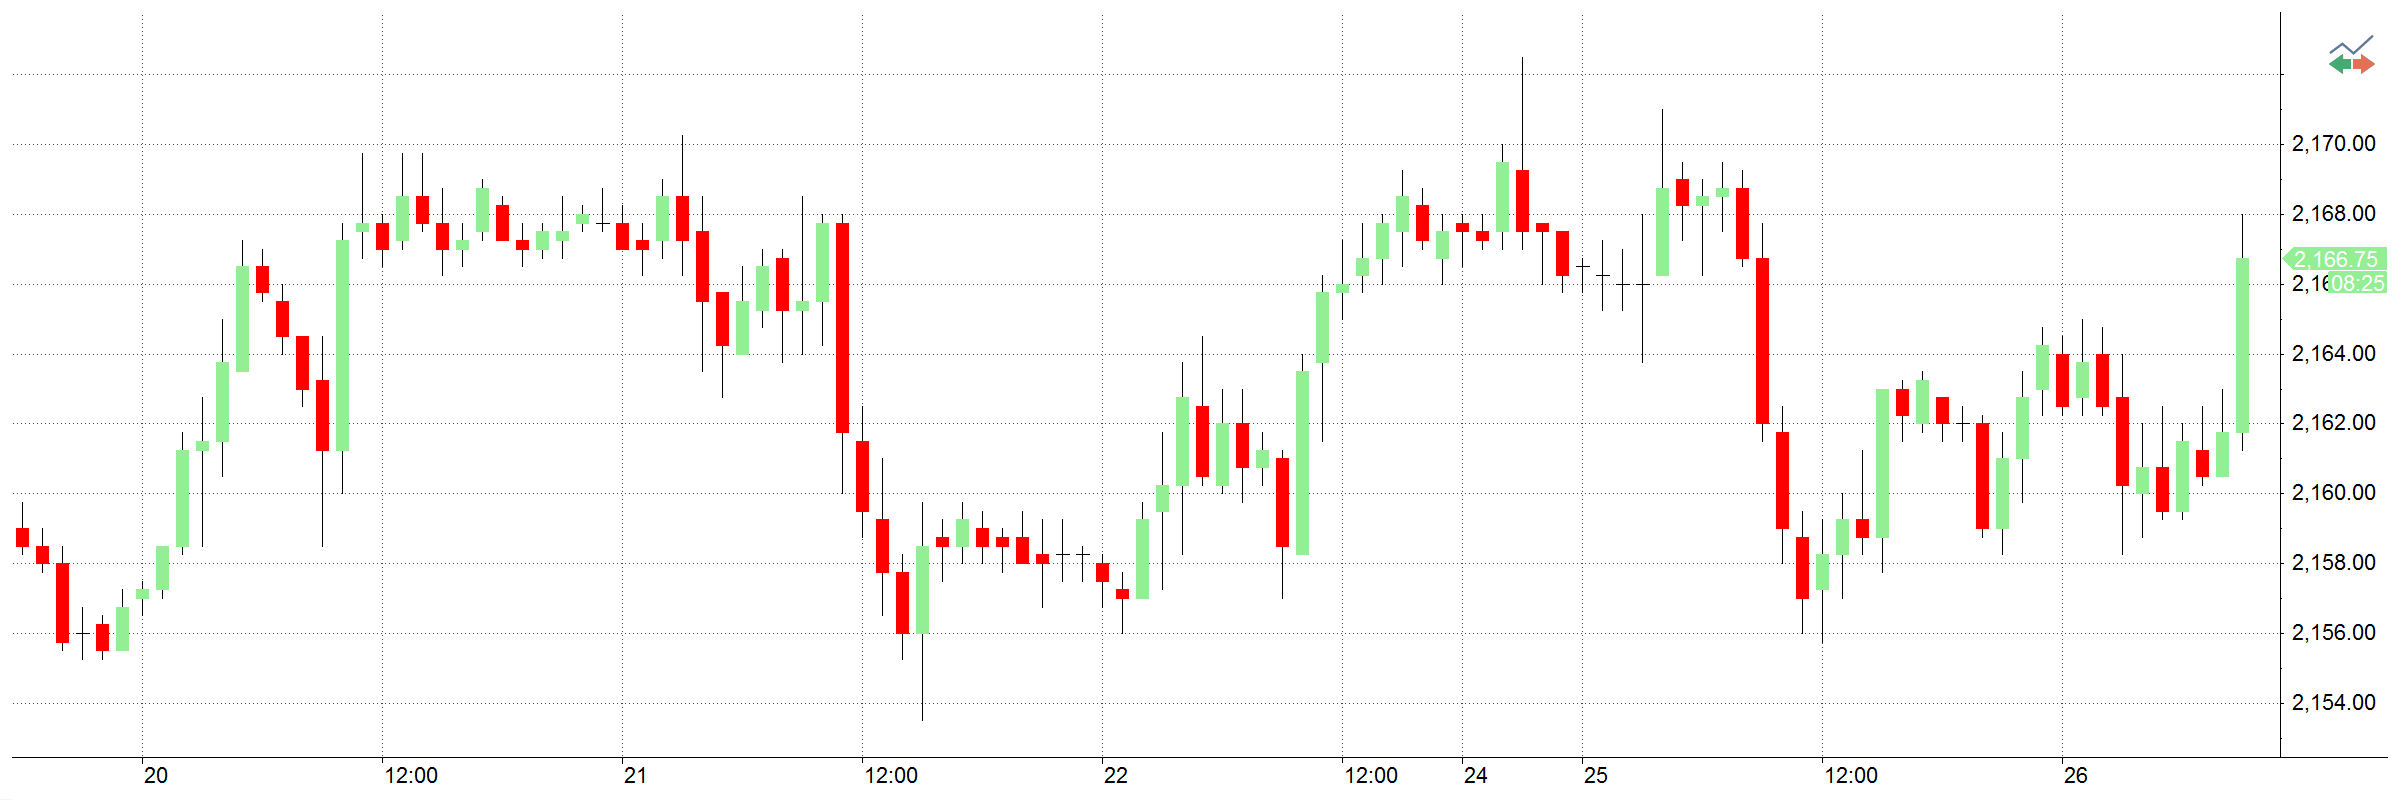
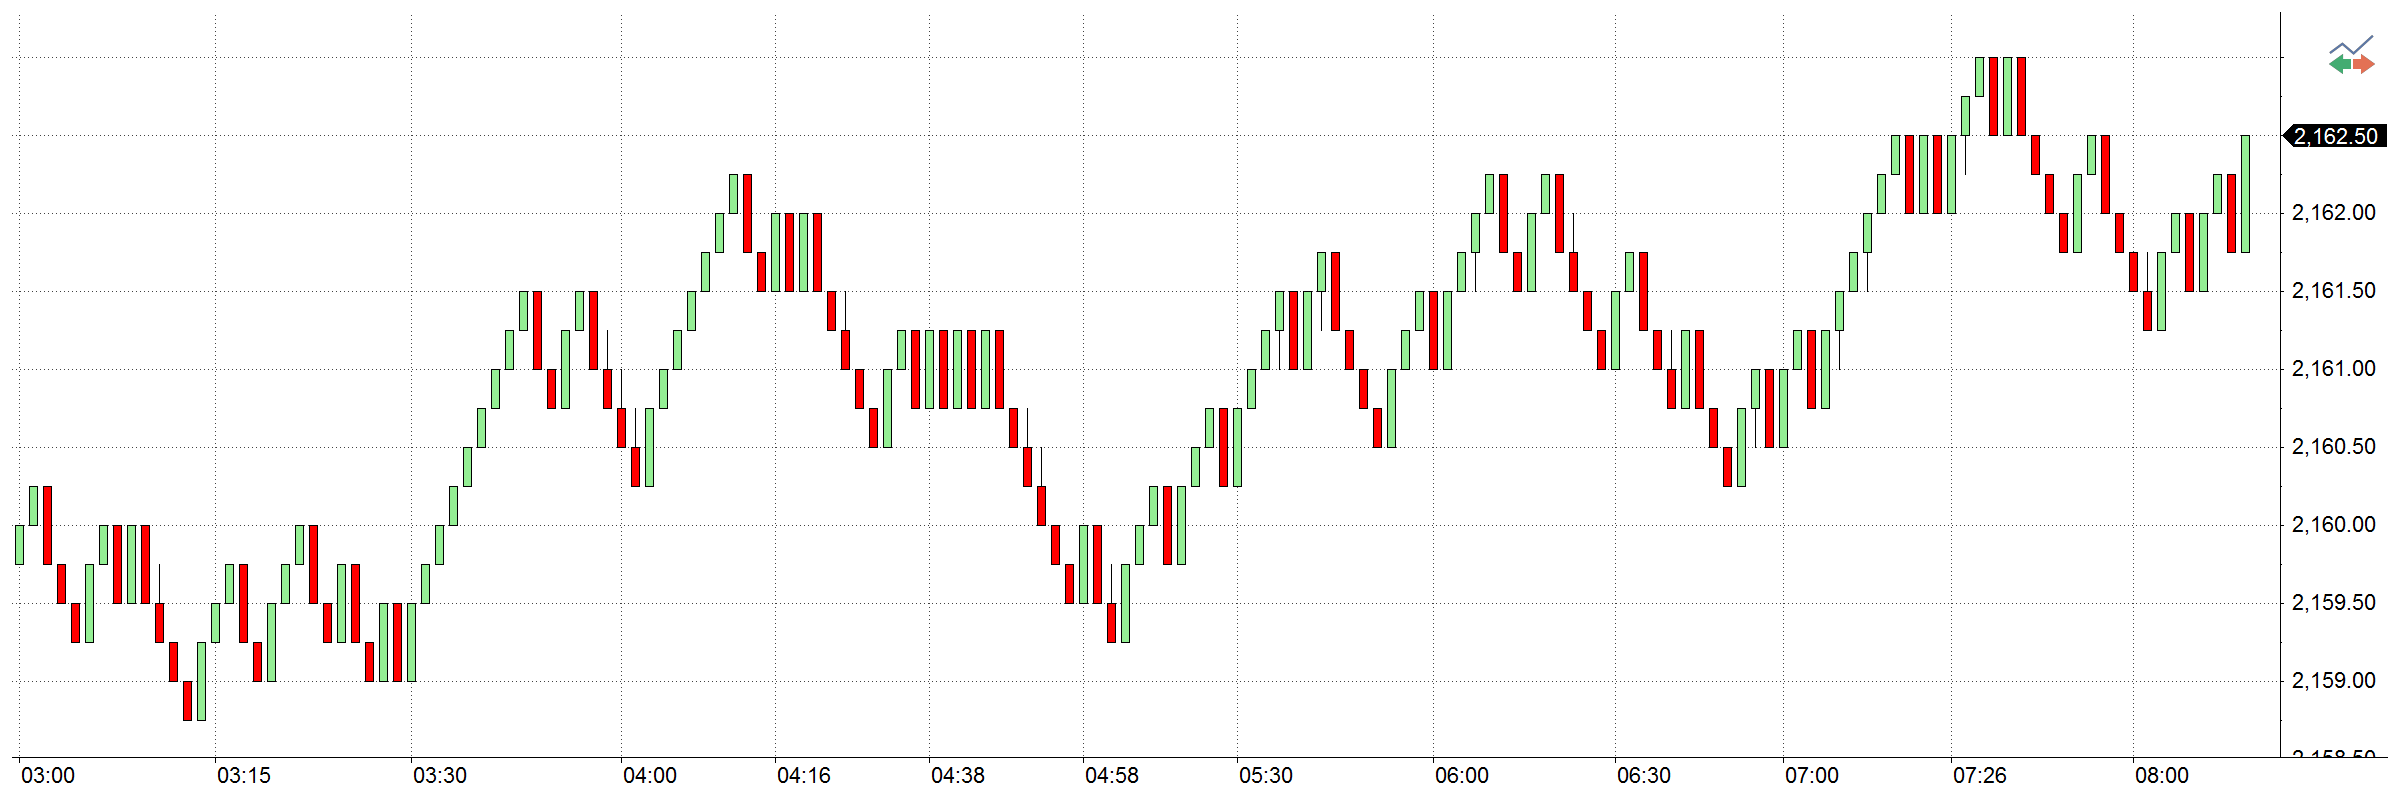
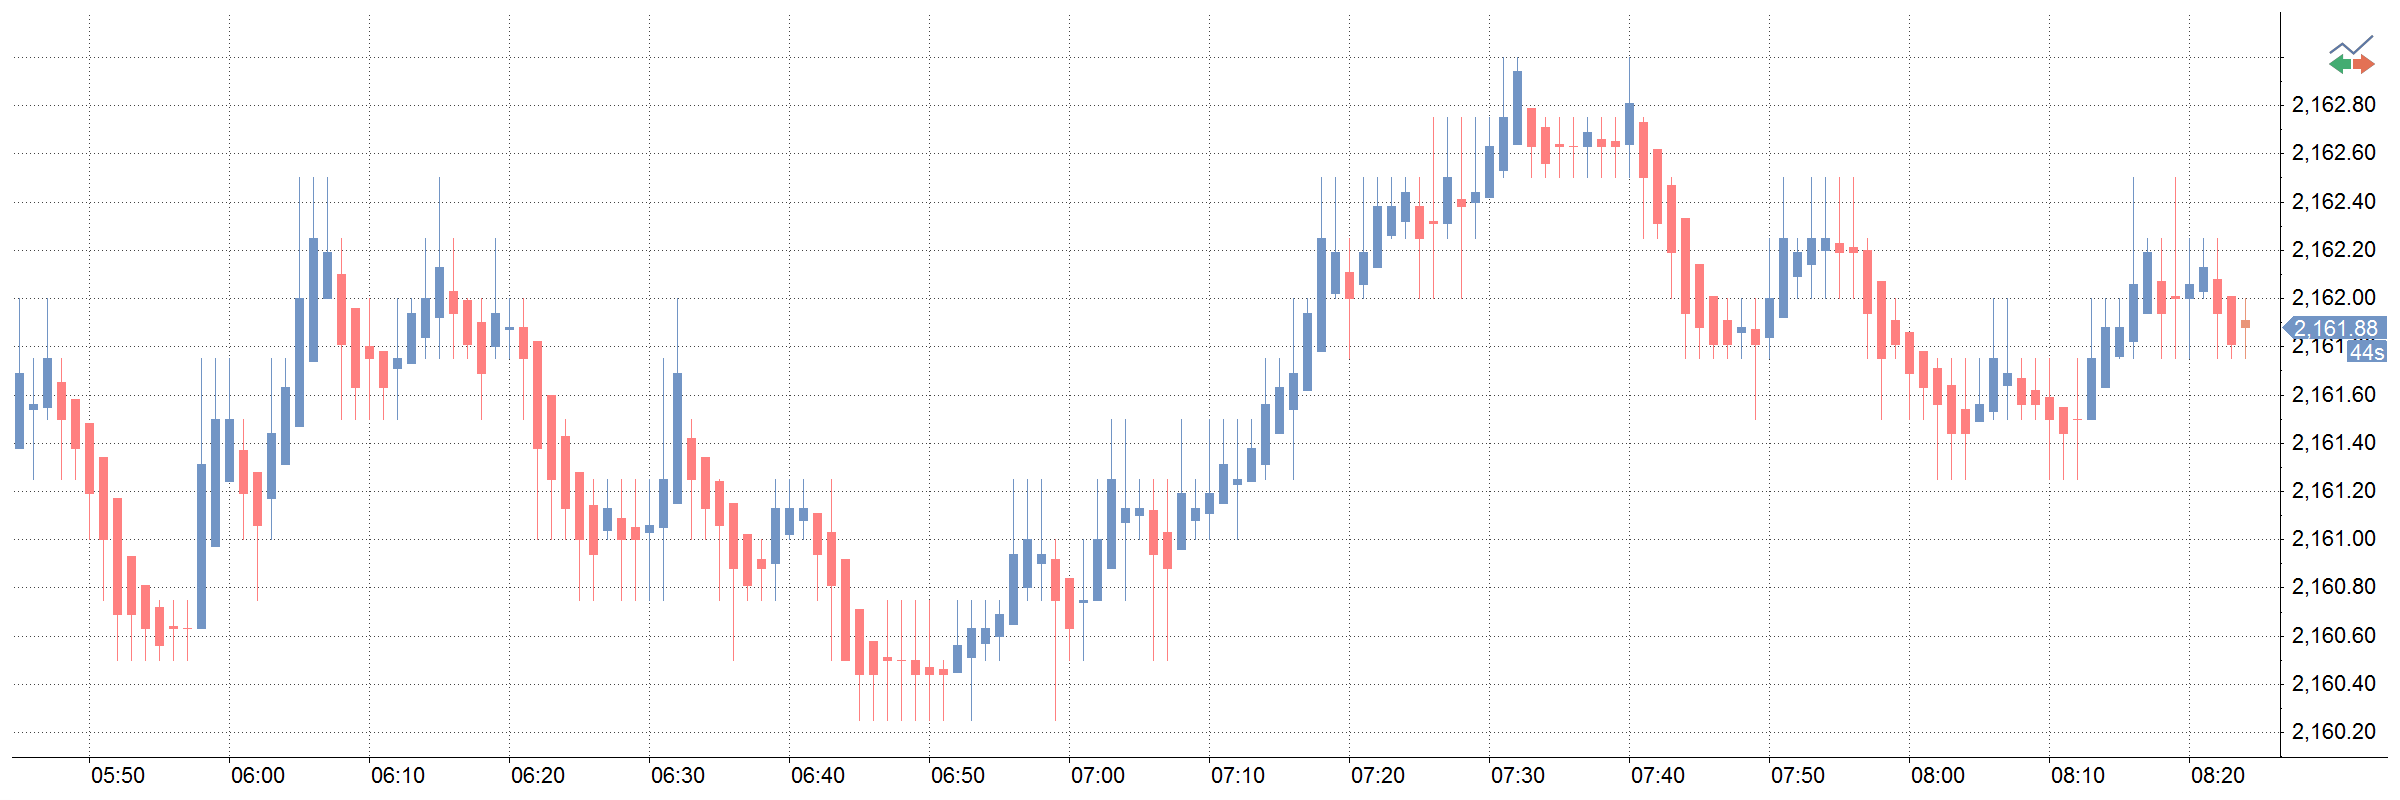
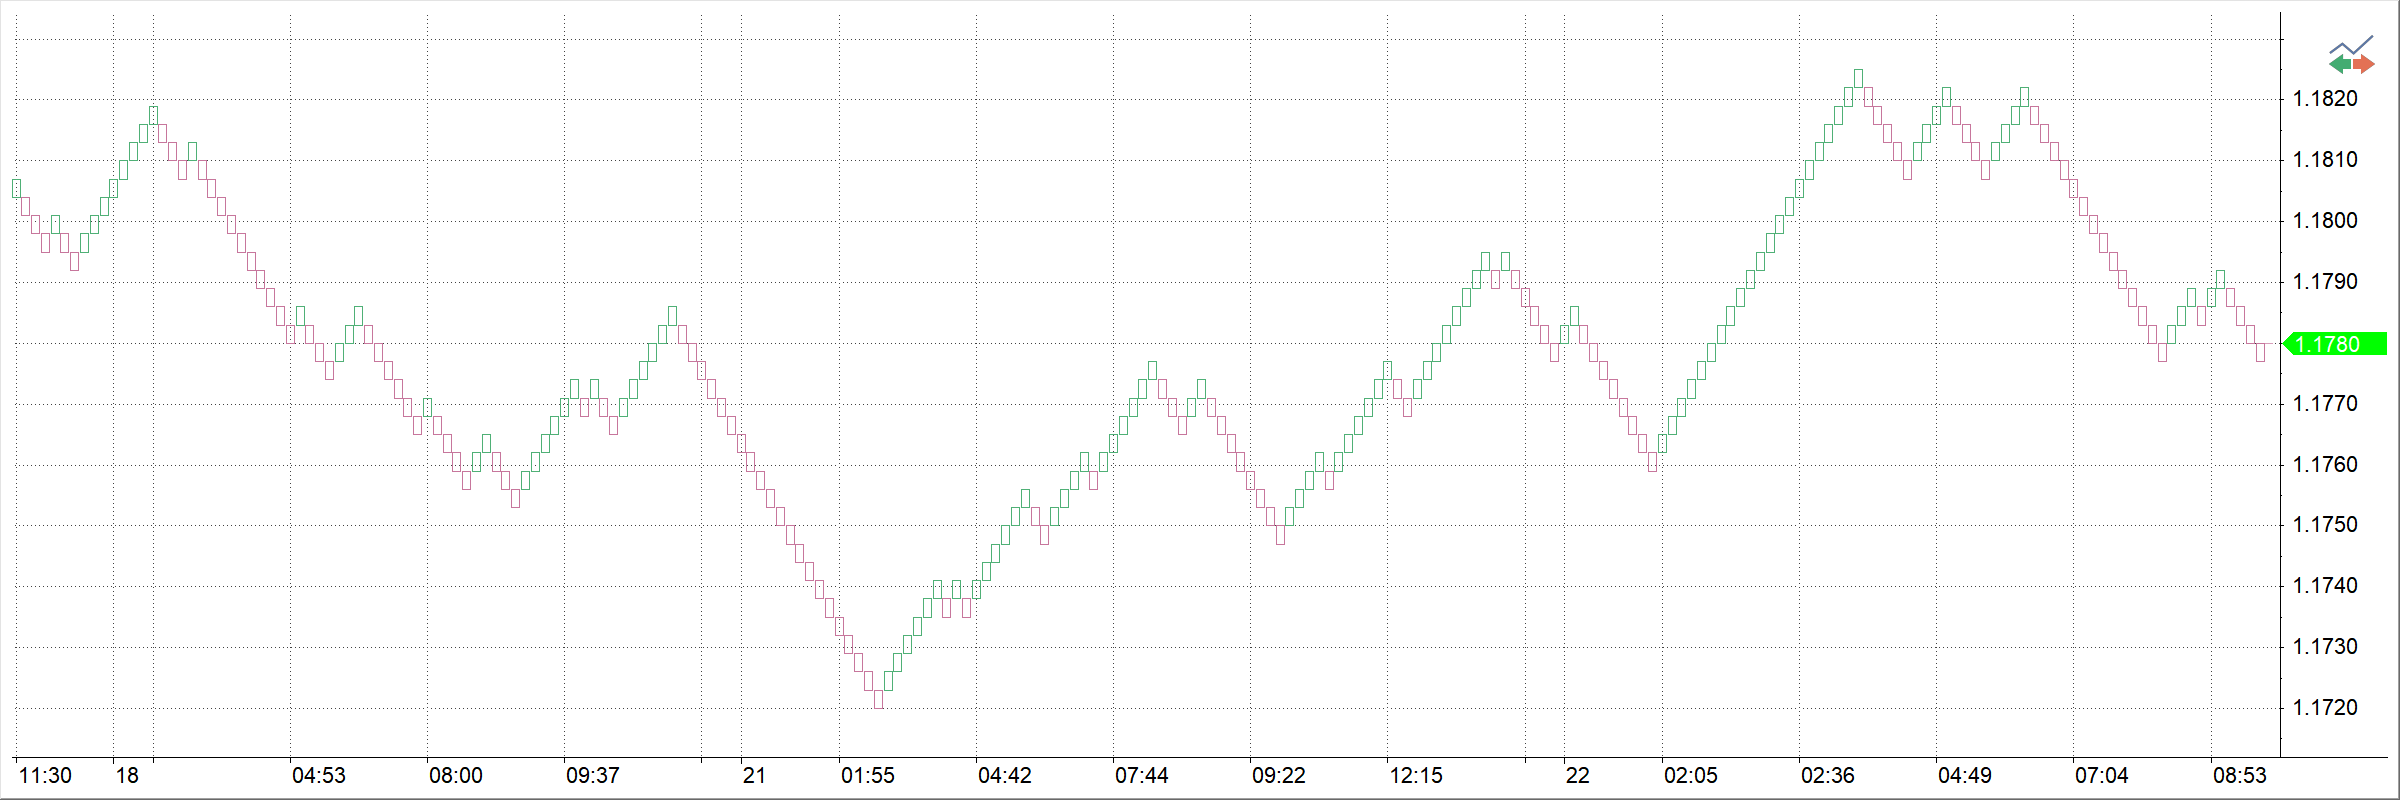
Candlesticks
This chart type uses the same price data as regular bar charts, with each candlestick representing the open, high, low, and close. The thick part, called the real body, represents the range between opening and closing prices. Long thin lines, shadows and wicks/tails, represent the range of price movement for the bar.
MultiCharts
MultiCharts
Renko
This chart type only plots price movements, without taking time or volume into consideration. It is constructed from ticks and looks like bricks stacked in adjacent columns. A new brick is drawn after the price passes the top or bottom of previously predefined amount.
Kagi
This chart type looks like a continuous line that changes directions and switches from thin to bold. The direction changes when the price changes beyond a predefined amount, and the line switches between thin and bold if the last change bypassed the last horizontal line.
MultiCharts
MultiCharts
BetterRenko
This chart type differs from traditional Renko bars in two main ways: it plots only real data and it displays data outside of boxes as wicks. It removes noise while being useful for backtesting.
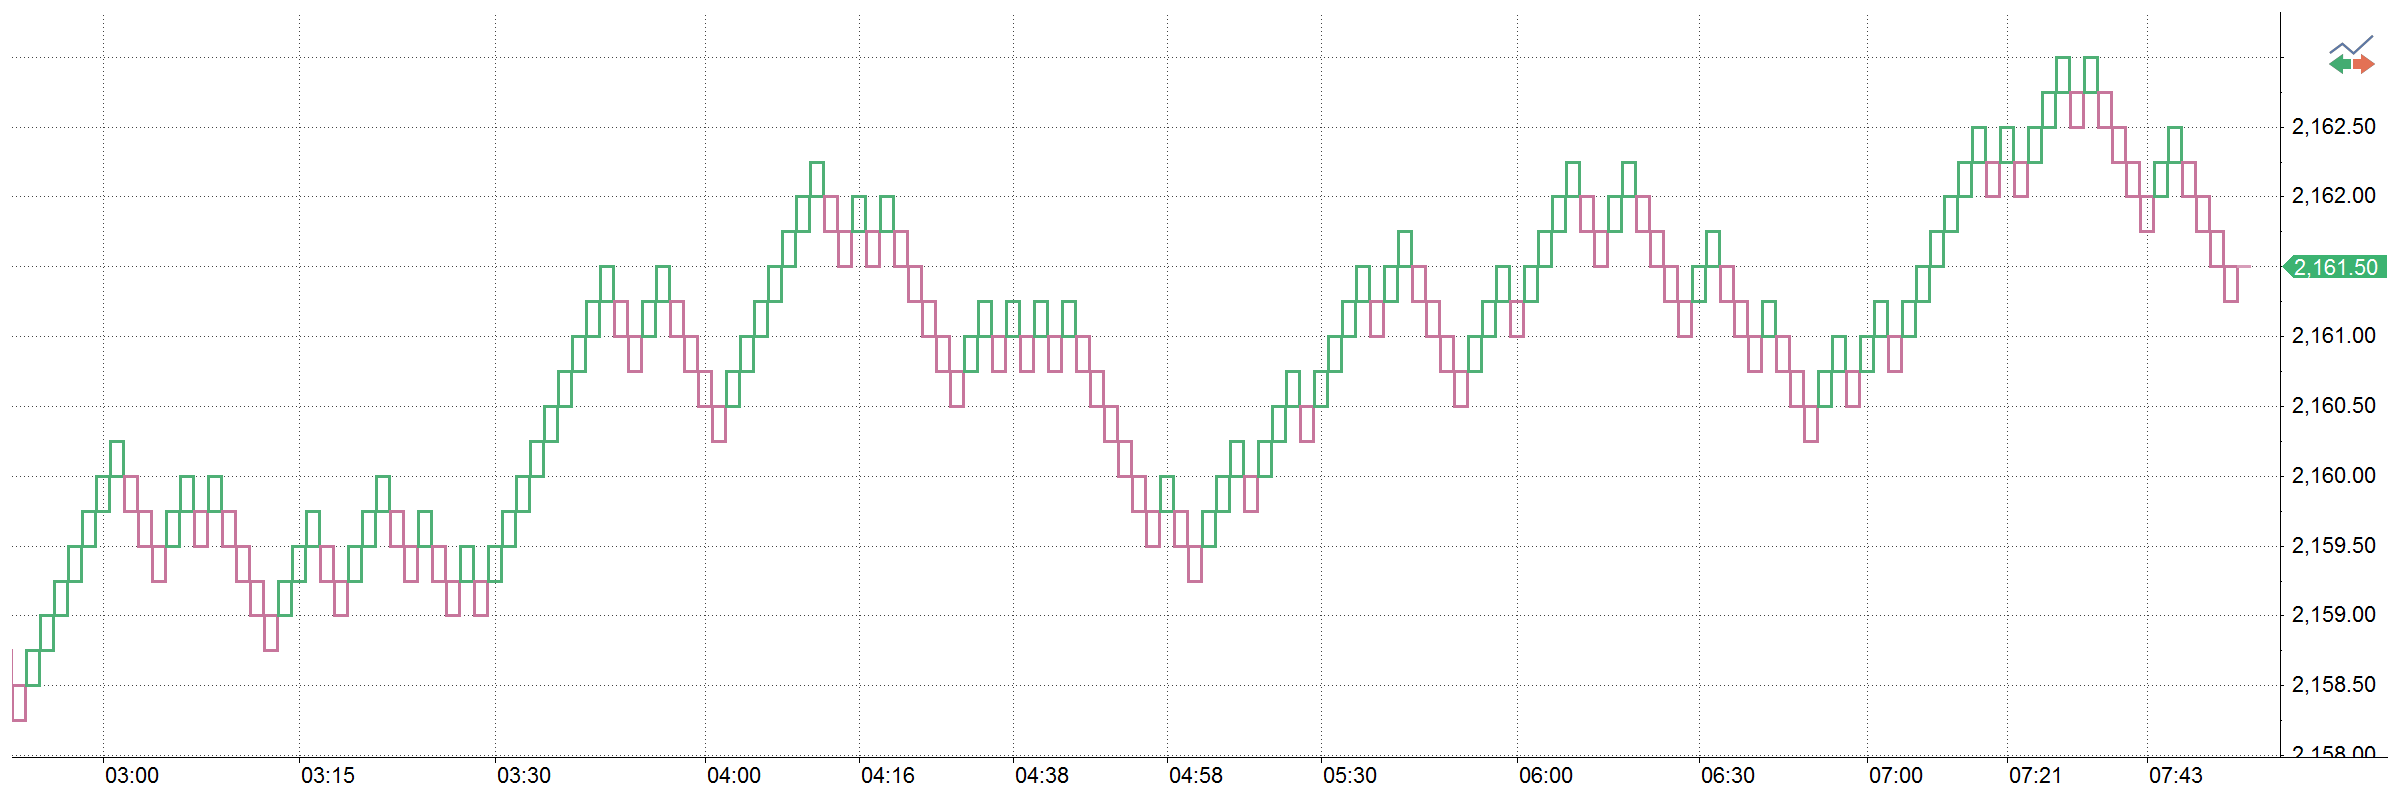
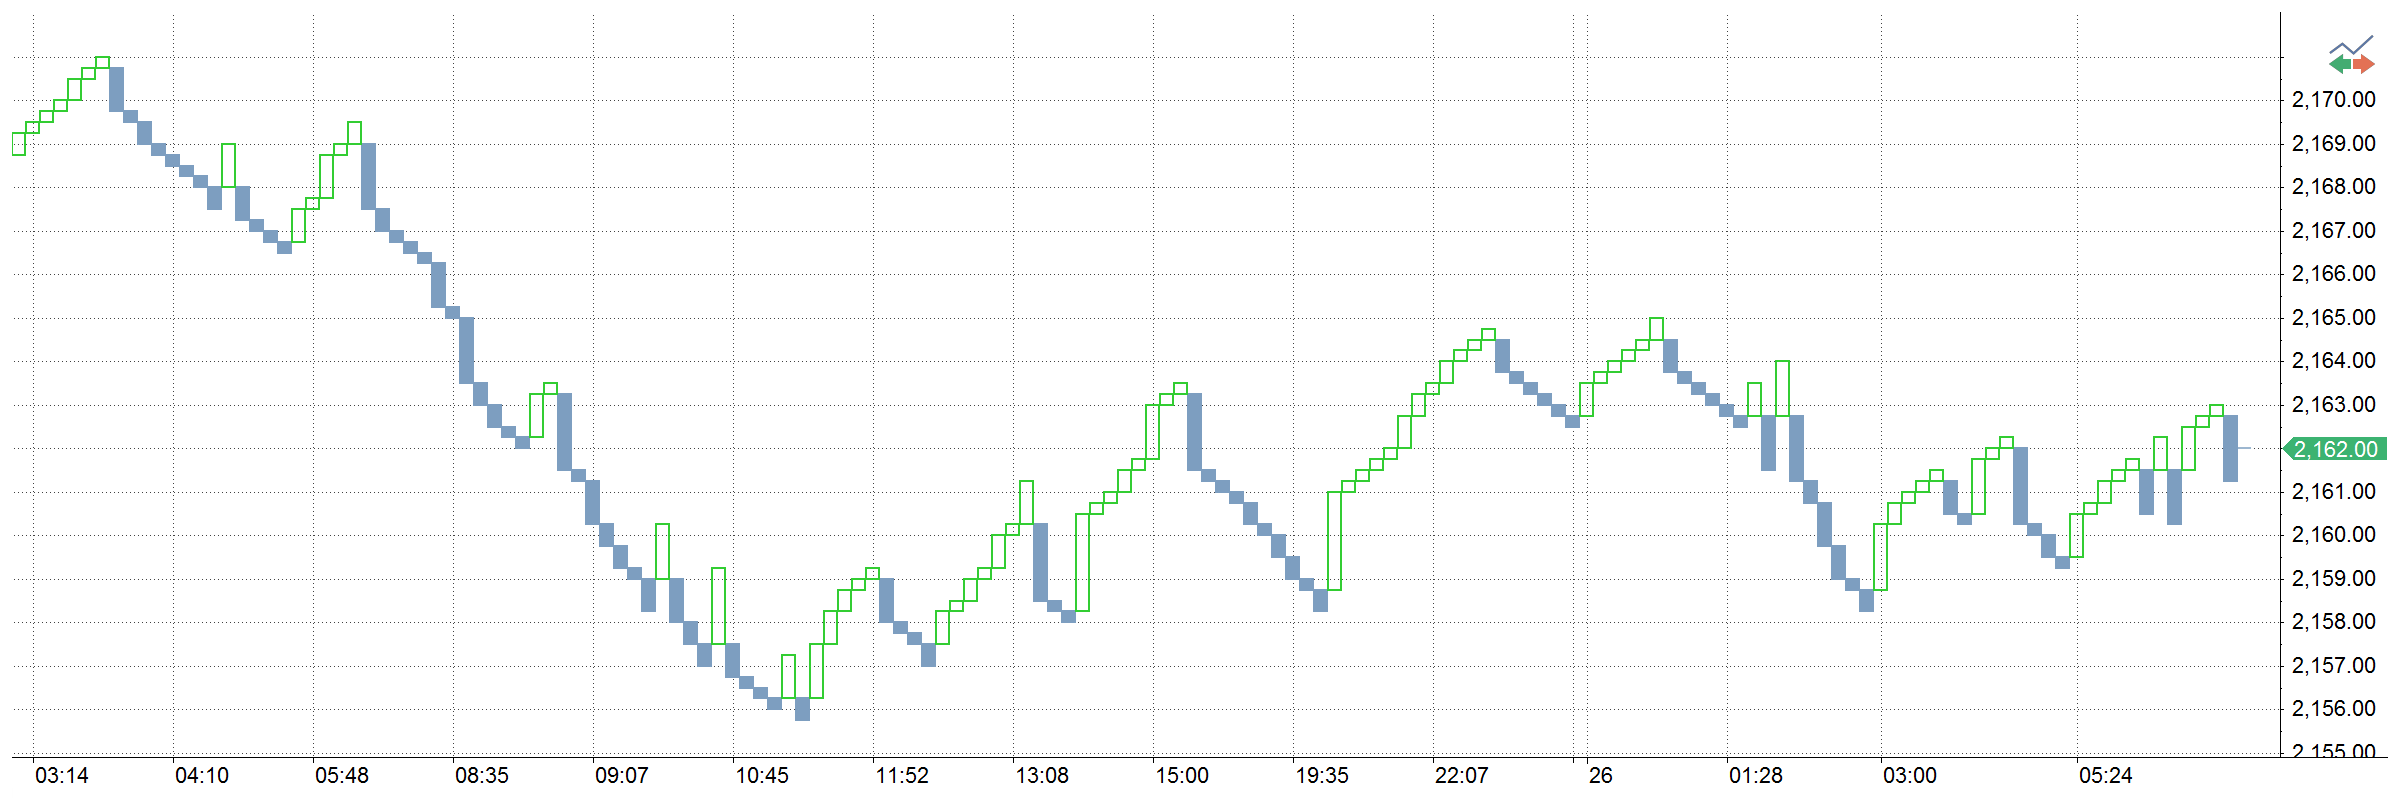
3 Line break
This chart type only plots price movements, without taking time or volume into consideration. This chart type displays a series of vertical boxes that are based on price changes.
MultiCharts
MultiCharts
Heiken-Ashi
Heiken-Ashi means “average bar” in Japanese. Open, High, Low and Close prices of HA candlesticks are not actual prices, they are results from averaging values of the previous bar, which helps eliminate random volatility.
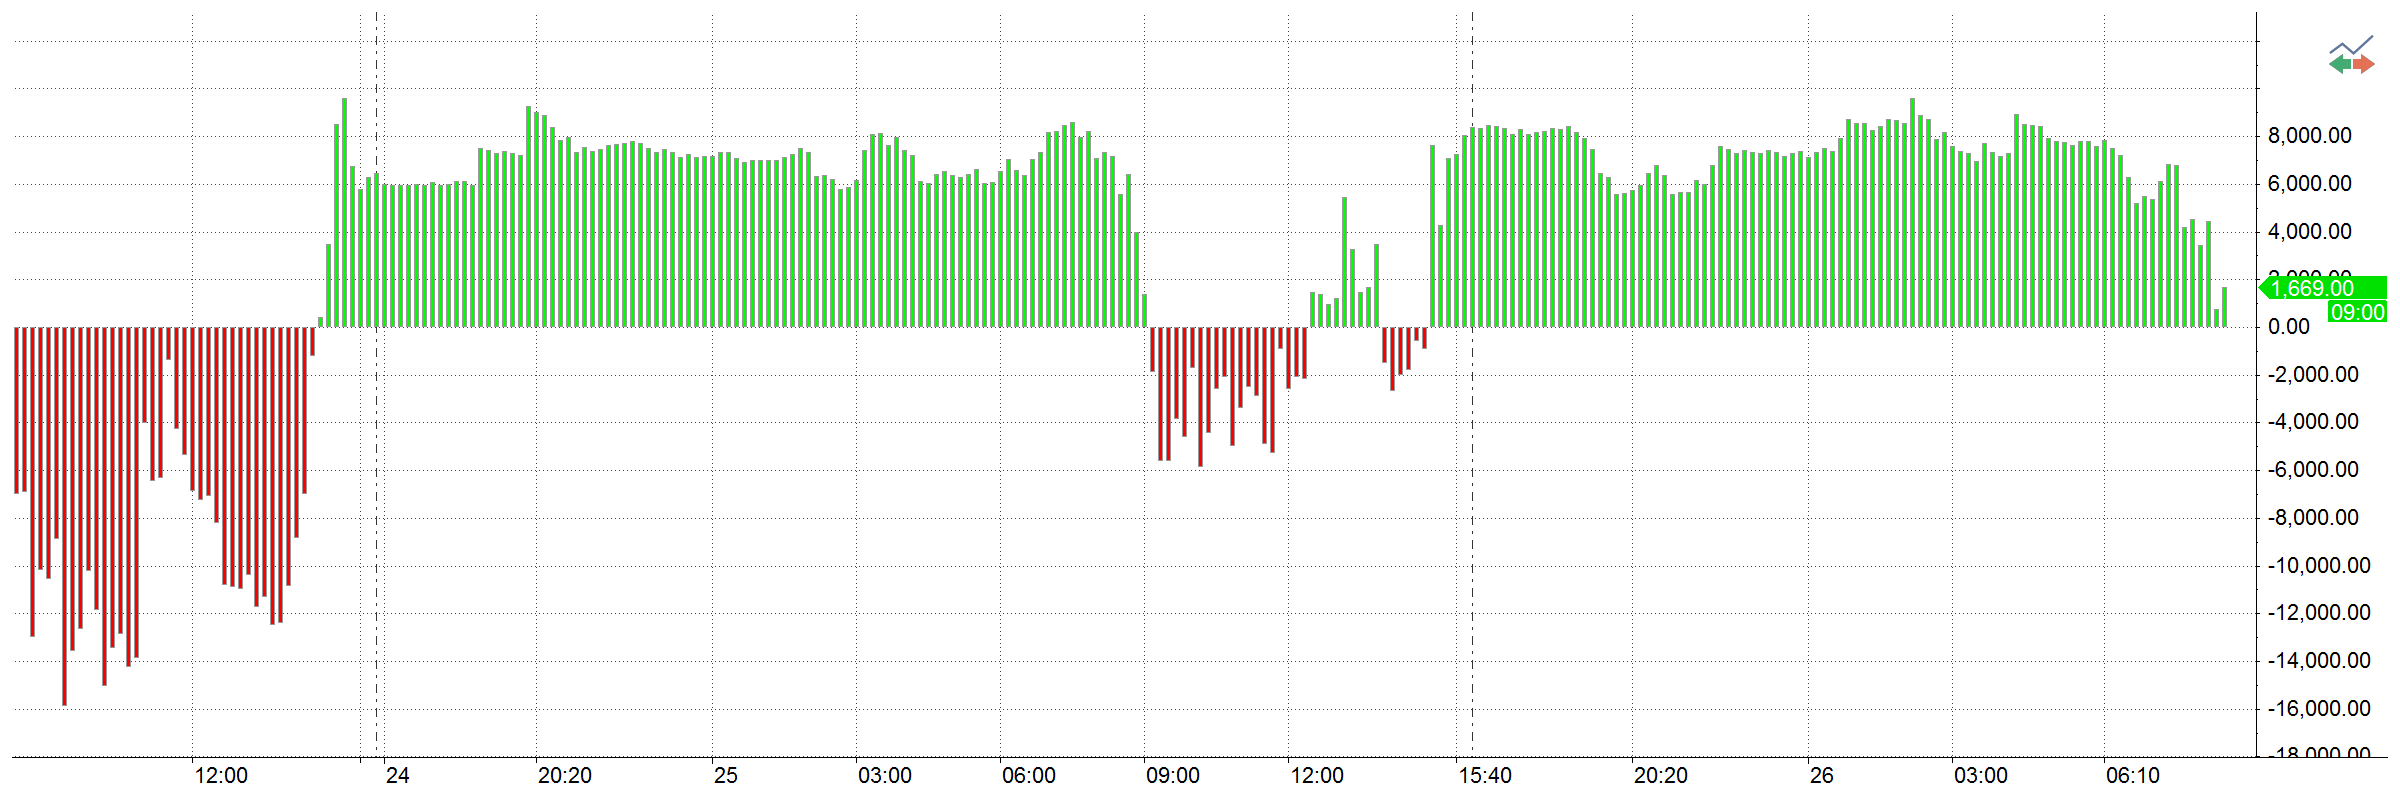
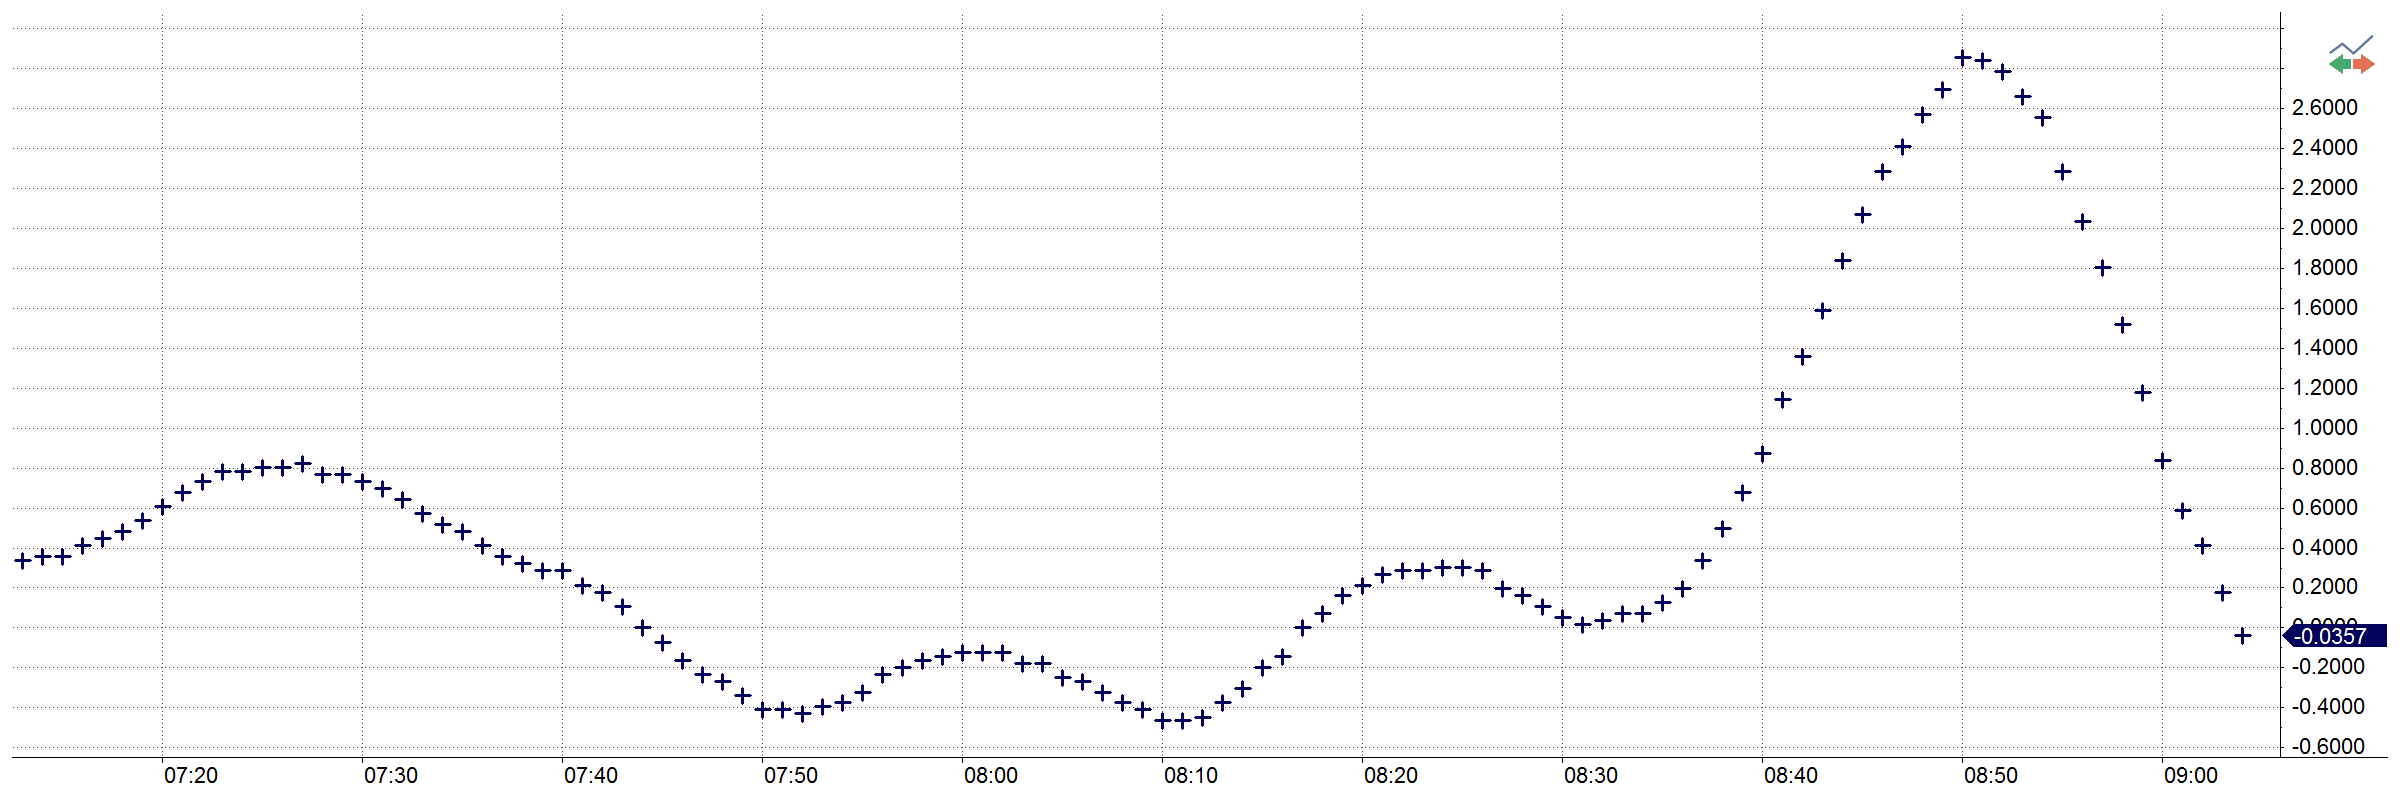
Cumulative Delta
Cumulative Delta is based on direction-based volume accumulation, not on price. The scale of the chart shows volume and bars represent accumulated delta (buy – sell) of the volume for specified resolution. In trending markets CD will move into positive or negative values, while it will oscillate around zero in non-trending markets.
MultiCharts
MultiCharts
Hollow Candlesticks
Hollow candlesticks appear when the closing price is greater than the open, and filled candlesticks appear when the closing price is less than the open. This is the only difference from a regular candlestick chart.
Candlesticks with border
The only difference from a regular candlesticks chart is the borders around the body of the candle.
MultiCharts
MultiCharts
HLC
The only difference from an OHLC bar is that the opening price is not shown.
Invisible Bars
This functionality hides the chart from view, yet it can still be used for calculations. For example, if only indicator information is needed to be seen, you can hide the data series so you are not distracted.
MultiCharts
MultiCharts
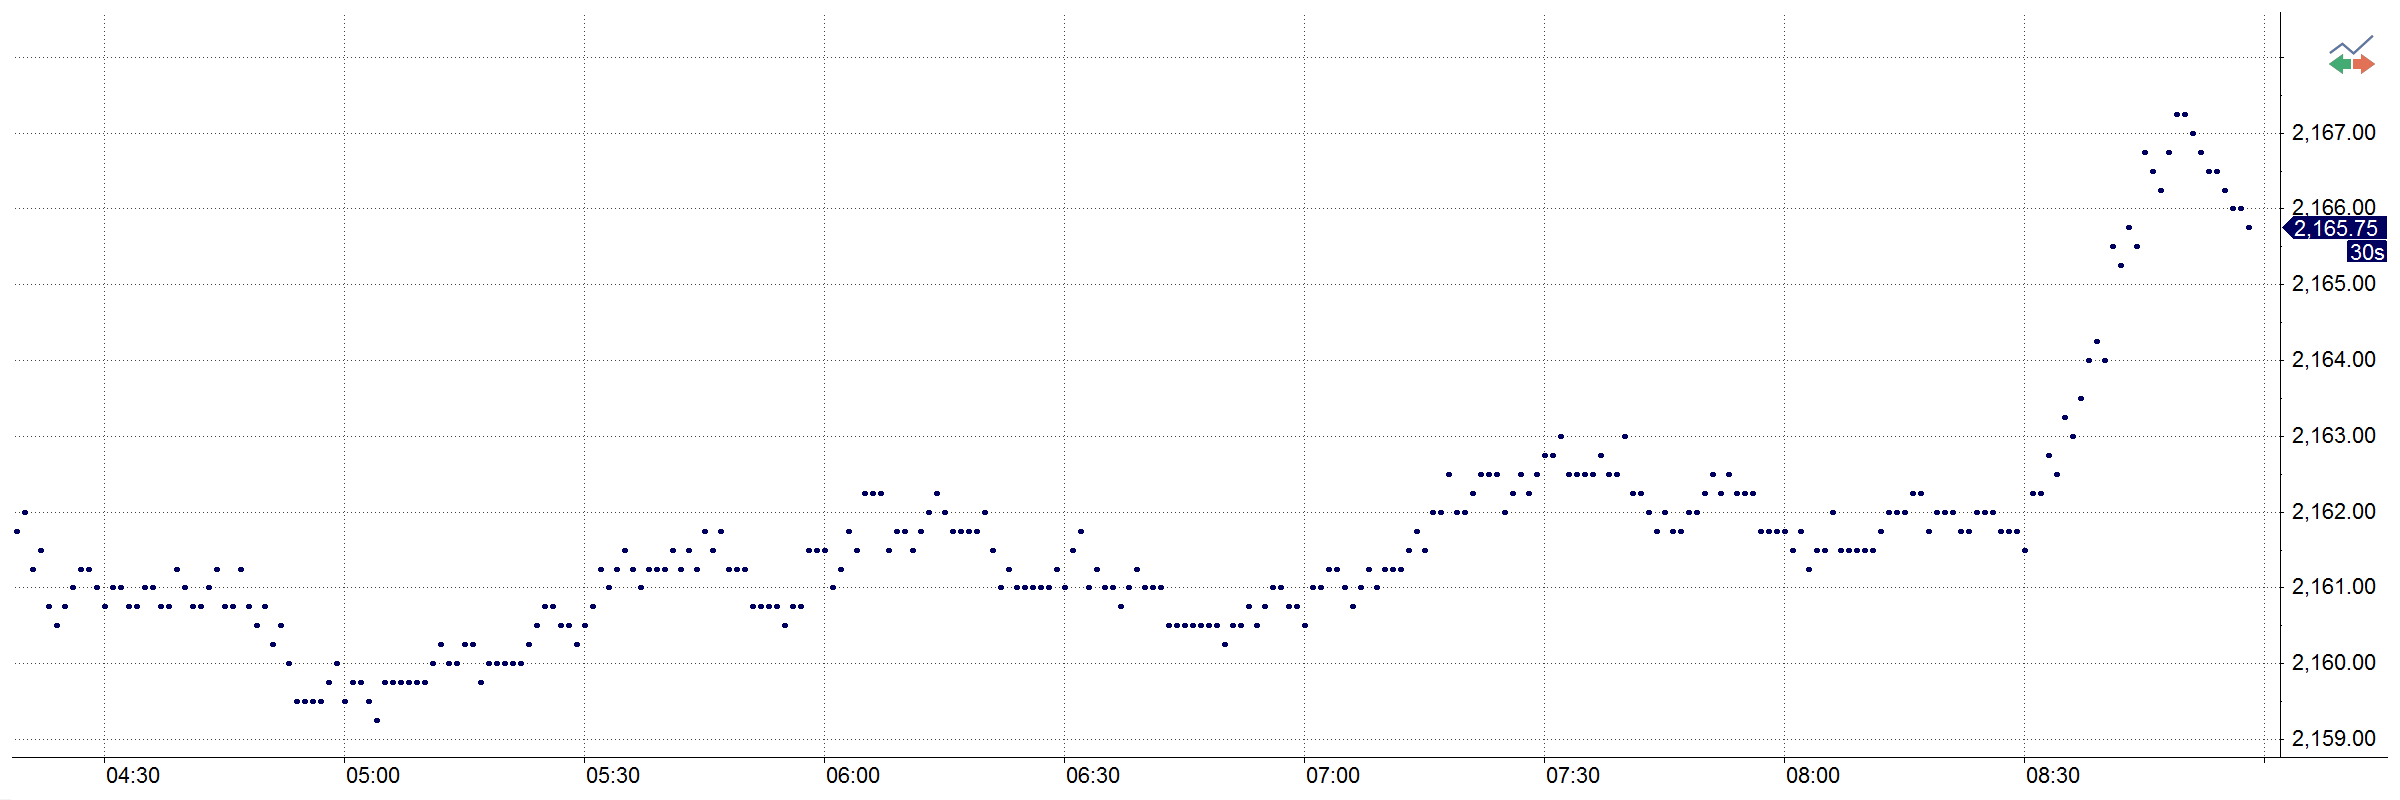
Dots
This chart type plots a single dot at the closing price of each bar.
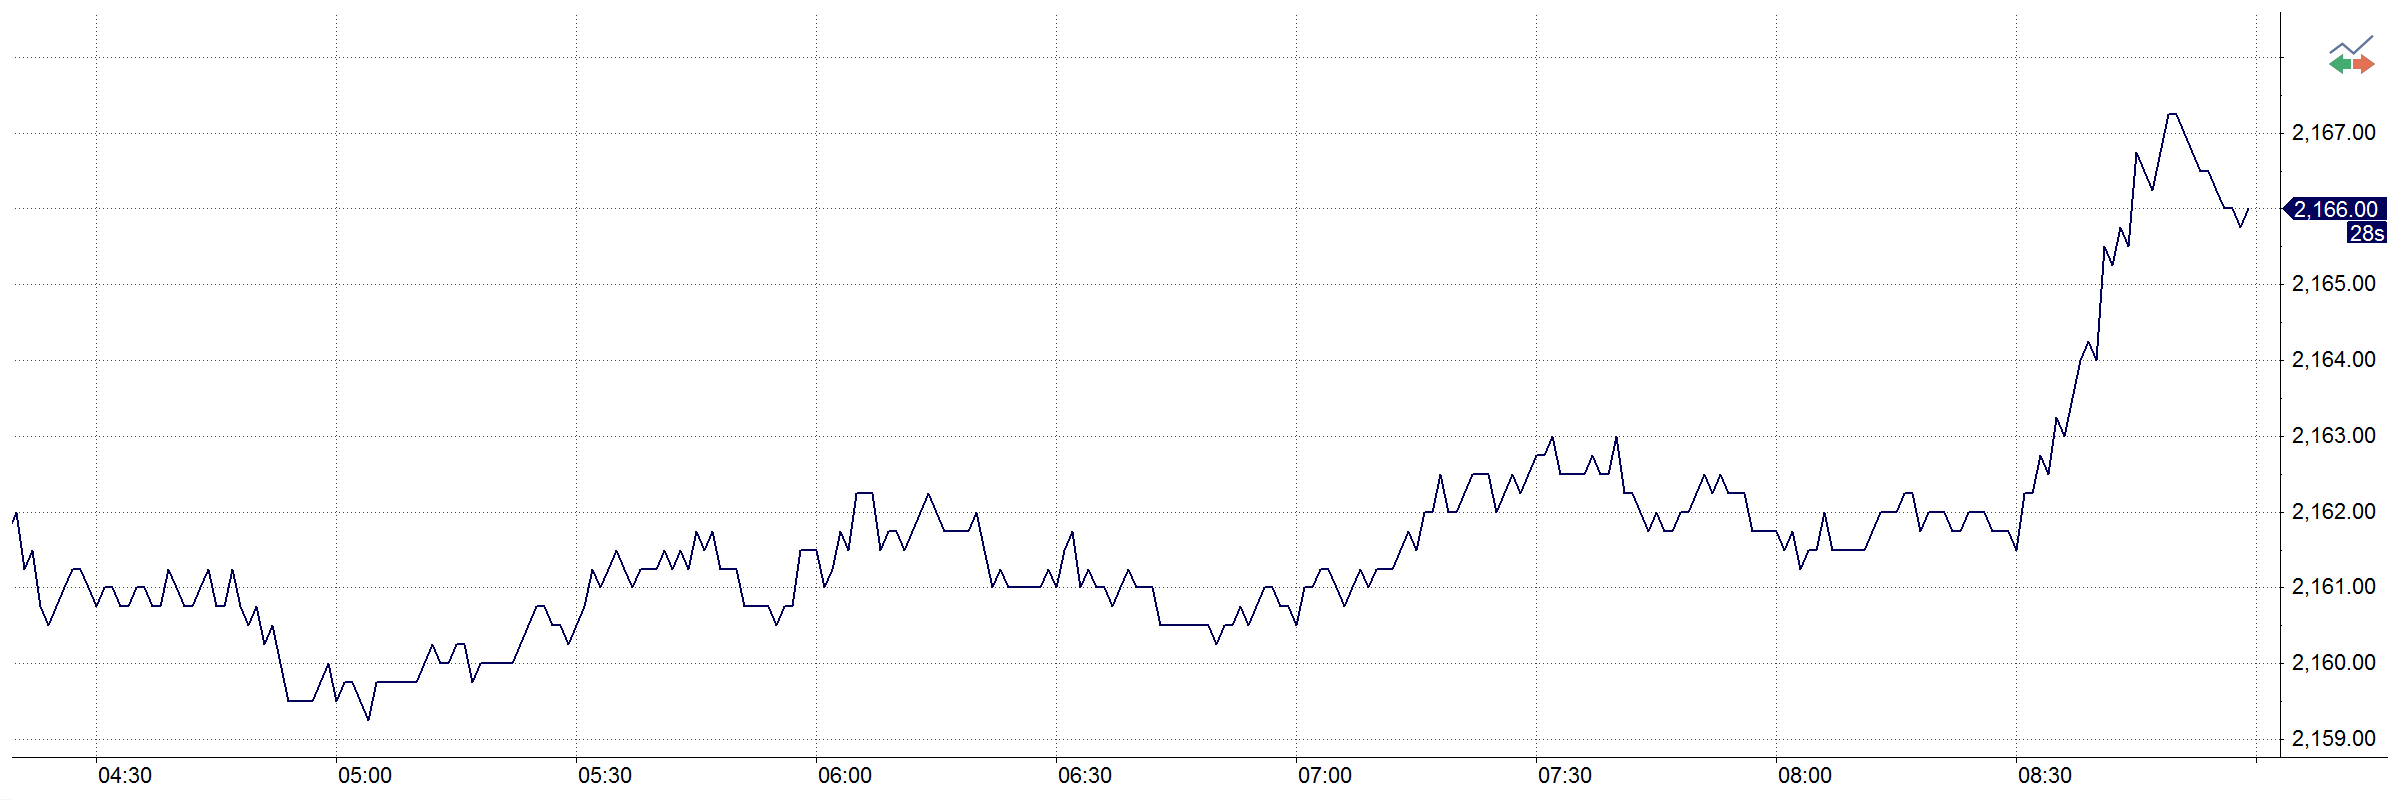
Line on Close
This chart type connects the closing price for each bar with a line.
MultiCharts
MultiCharts
Symbol Chart
This chart type plots crosses at specified price values (indicators only).
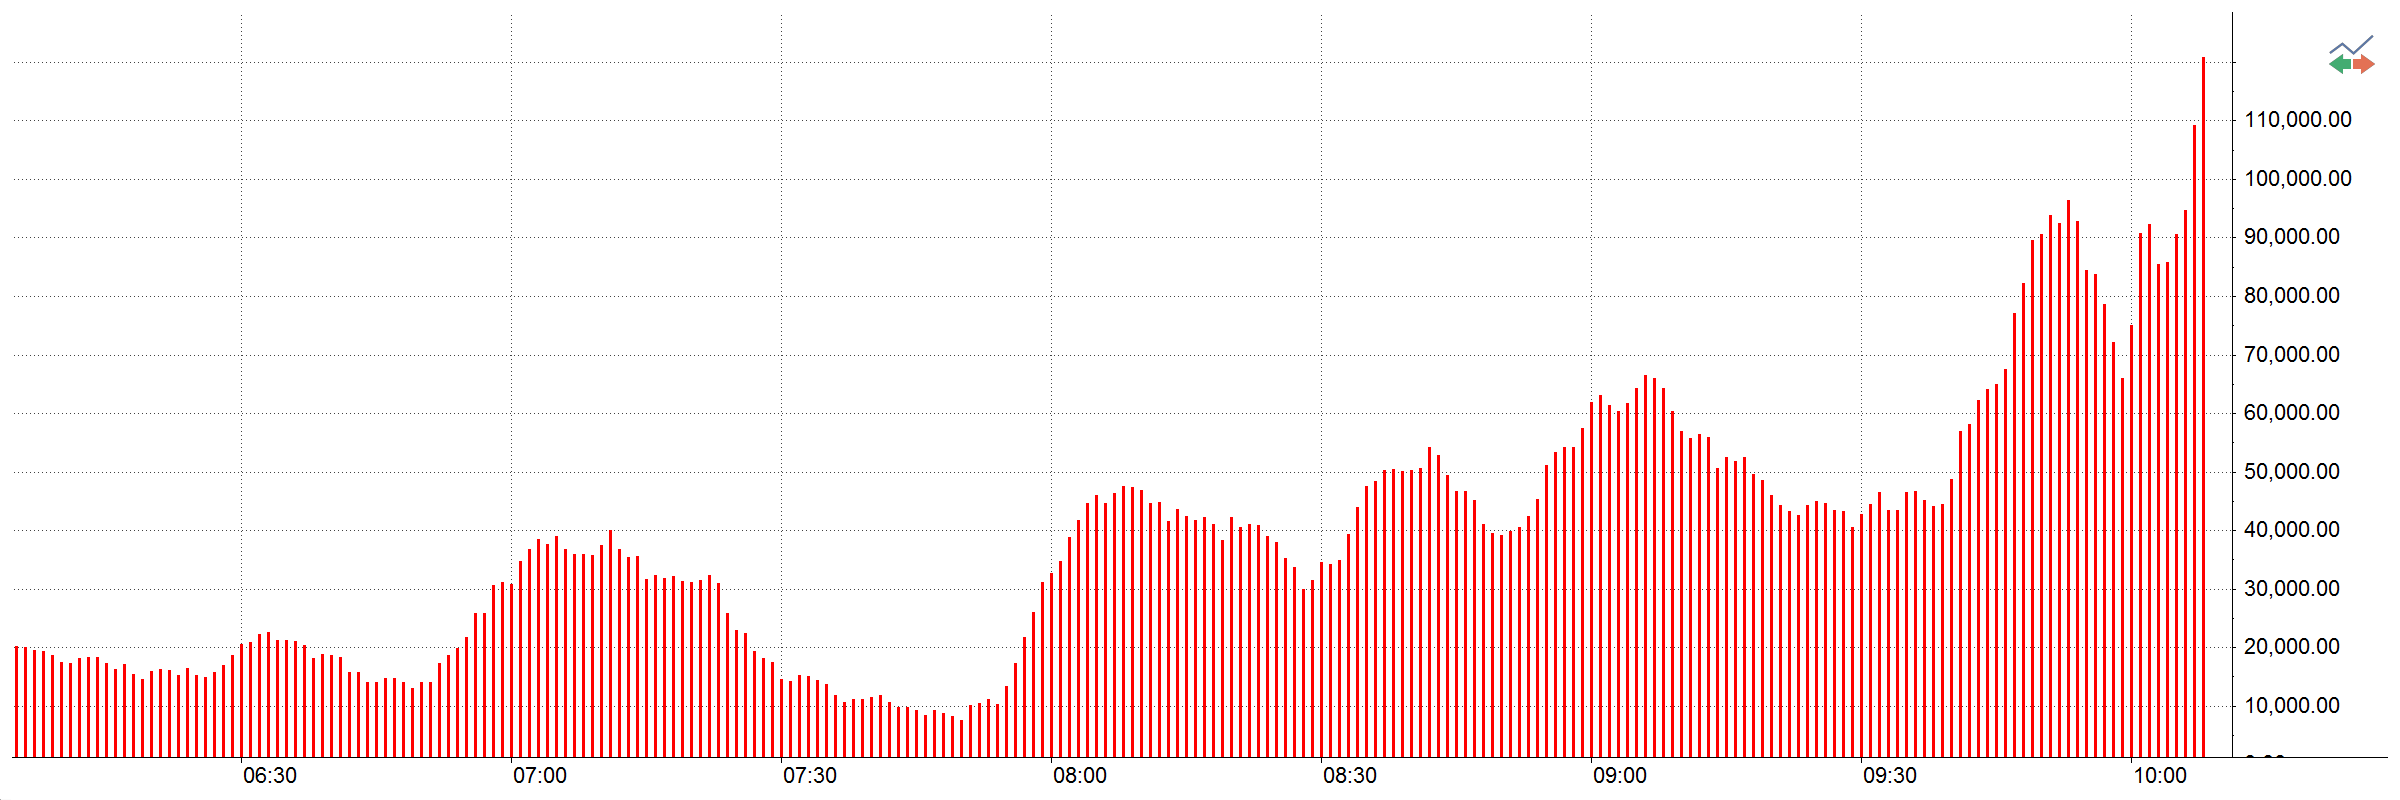
Histogram chart
This chart type plots vertical lines, which can be based on volume, price, and other factors.
MultiCharts
MultiCharts
FlexRenko
As opposed to classic Renko bars FlexRenko bricks are displaced in relation to one another on price scale and constructed from some intermediary point of the High-Low interval of the previous bar.
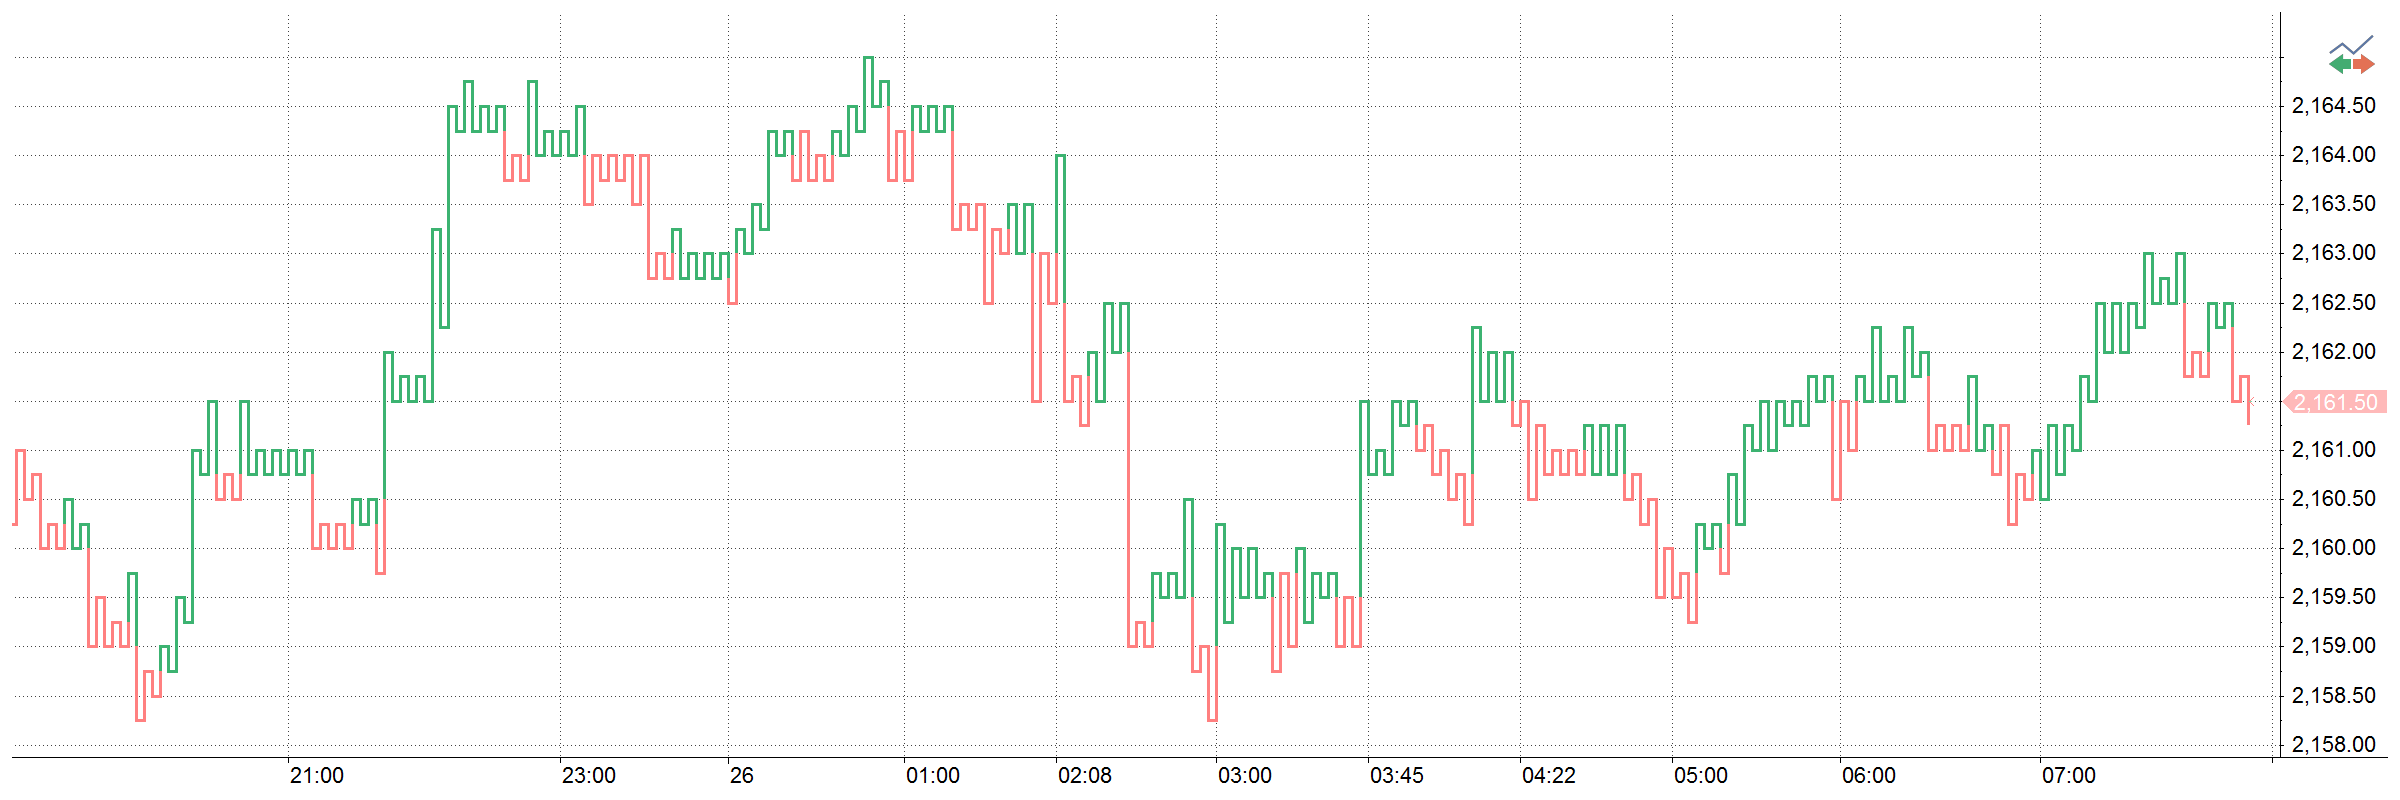
Reversal Bar
This chart type is a special case of Point and Figure charts but they are constructed from the Real Open price of the time bar.
MultiCharts
MultiCharts
Imbalance Delta
Imbalance Delta is a special style for bar representation based on the correlation of Ask/Bid volume.