Recreate real-time trading
Our free playback and simulated trading allow you to place trades while playing back historical data. Everything you can do in regular live trading is now available in this mode. Chart trading, auto trading, volume profile — you can use all of these features on historical data in order to test and improve your trading strategy in the safe conditions of simulated trading.
Advanced simulated trading will make testing your trading strategy even more comfortable and closer to reality. In addition to all the features available in the standard simulated trading, you will be able to plot L2 (DOM) data for a more detailed analysis of your trading.
L2 data can be either collected from the data vendor you’re currently using, or downloaded from our servers. You will get access to data for a list of instruments that will serve as an excellent start for your testing.
MultiCharts
Multiple playback speeds
Data can be played back at any speed. You have complete control over how quickly market changes are displayed. You can change the playback speed according to how fast you want to replay.
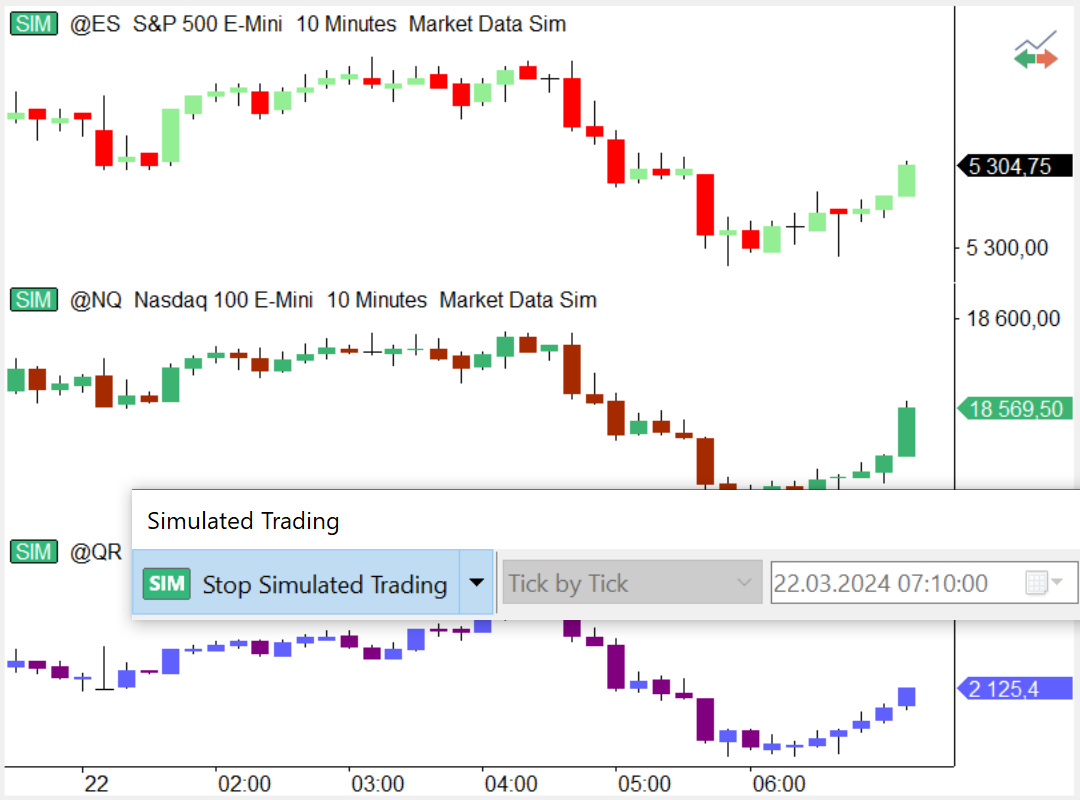
Different playback resolutions
Since you can have different charts (i.e. 5 tick, 13 minute, or 5 day), each bar on the chart represents different amount of data. You can playback the market "as is", which means one update equals one bar on your chart. You can also choose “Tick by Tick”, “Second by Second”, "Minute by Minute" or "Day by Day" as alternative playback options. If the playback resolution is lower than the resolution of the data series on the chart, additional detailed data will be downloaded from your data source. In this case status line indicates “Waiting for Detailed Data”.
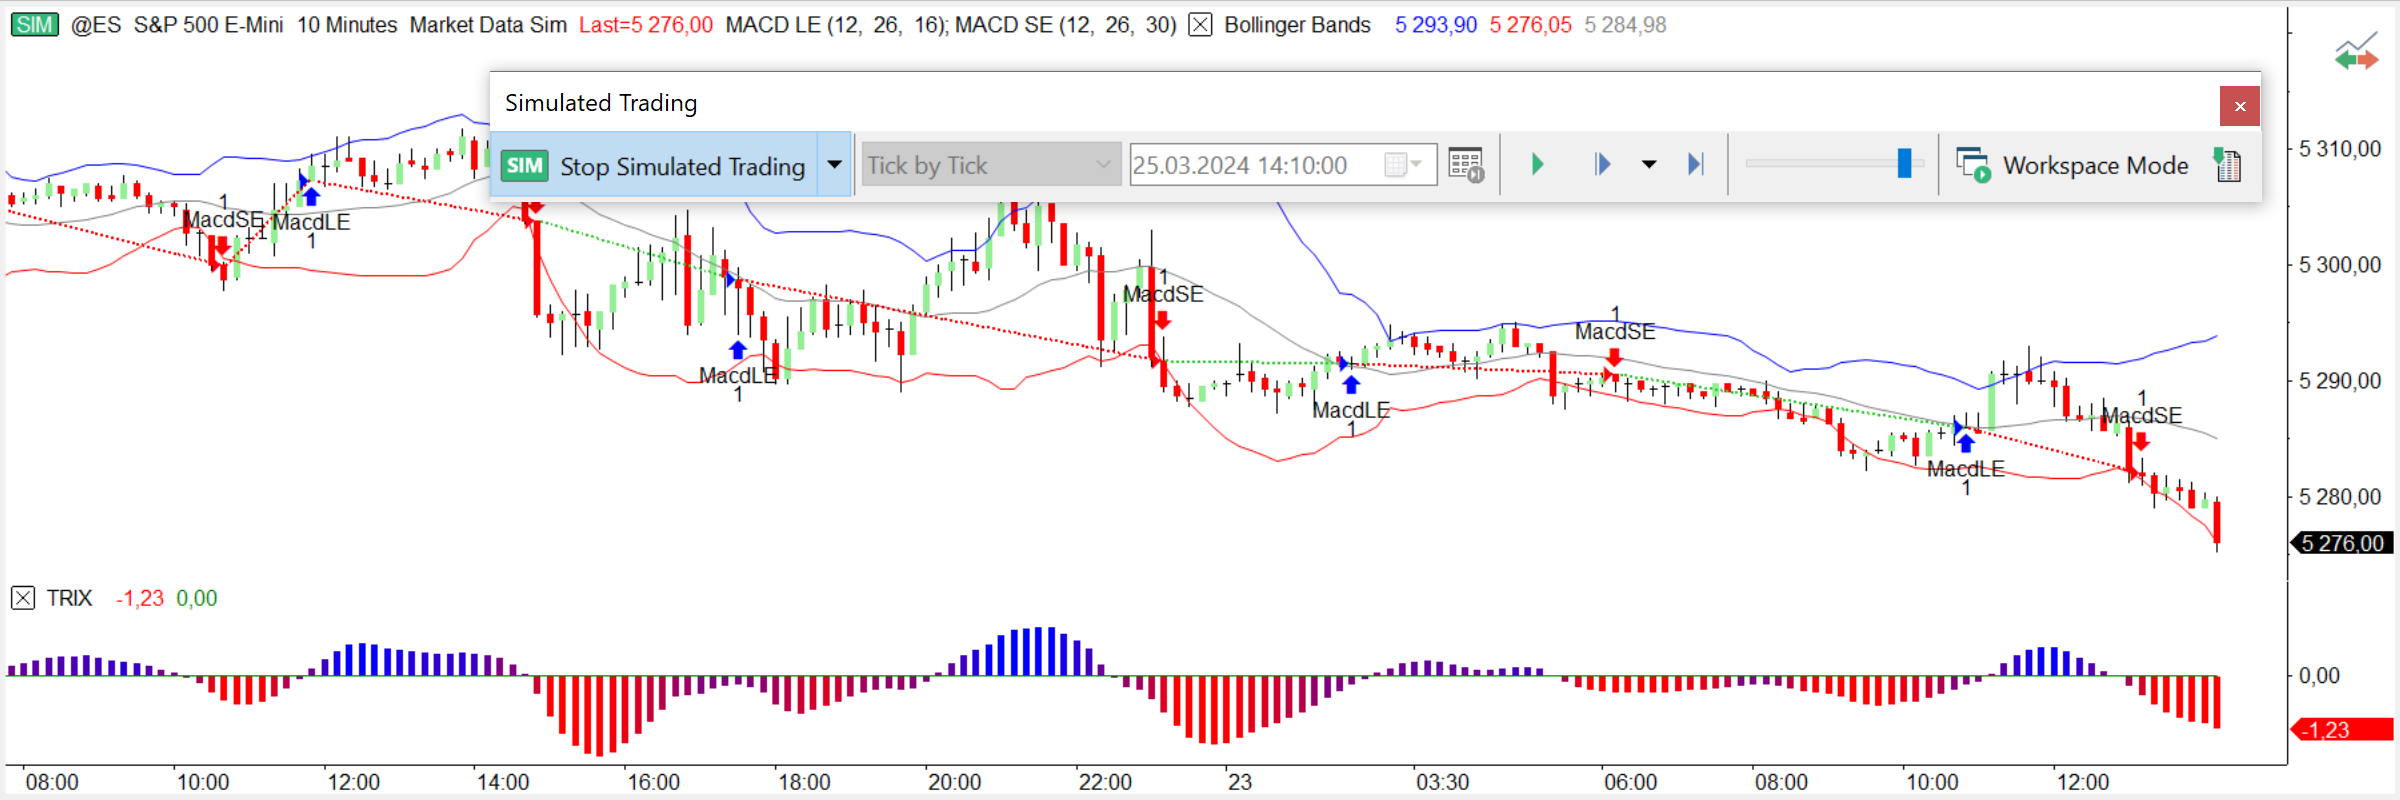
Jump forward instantly
You can jump any number of ticks forward on your intraday charts. For example, you might be playing back the S&P 500 and witnessing a slow market. You could easily skip forward until you see activity, instead of wasting your time waiting.
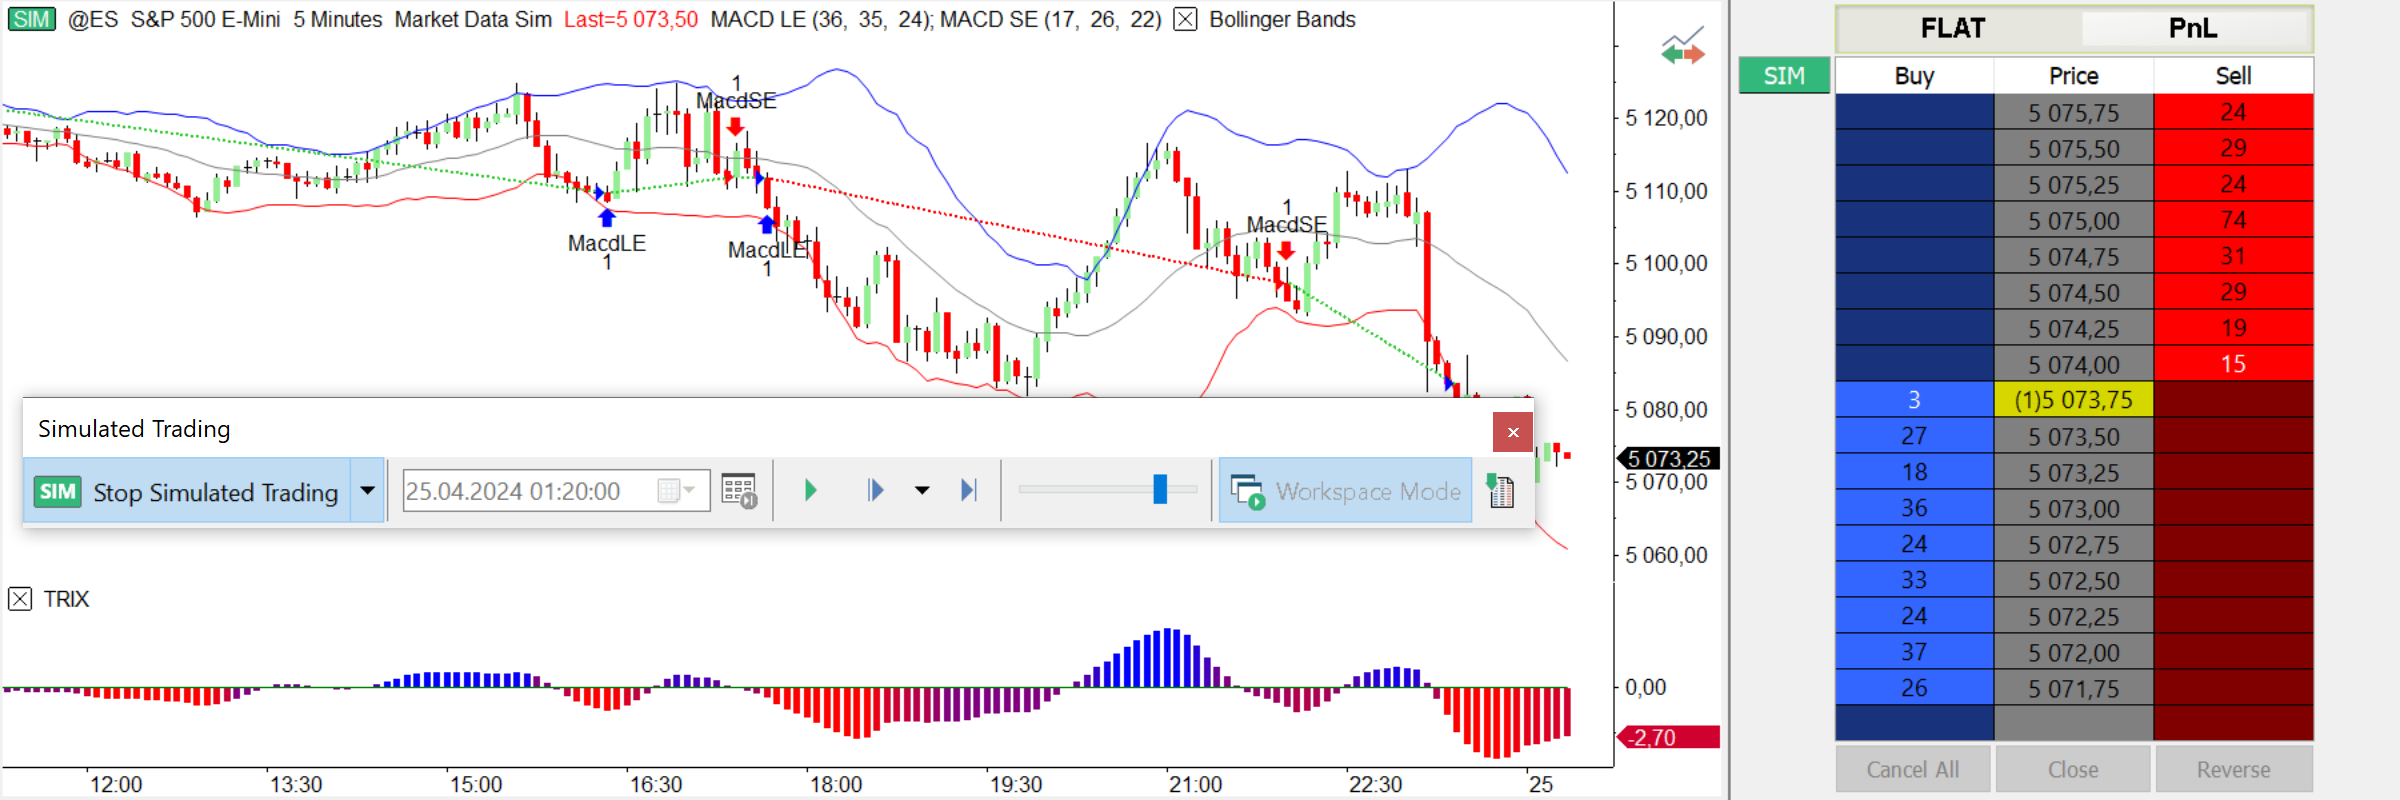
Replay different studies on several symbols together
Workspace Mode gives you the ability to playback an instrument in several places at once. For example, you might want to watch the Market Scanner, DOM window and each of the charts where you're following Google. Starting point, base resolution, and playback speed will be the same in all the windows that you are playing back in your workspace.
MultiCharts
Workspace Mode
Imagine that you have Google plotted in several charts, but each window has different technical indicators and strategies. With Workspace Mode you can replay all the charts within your workspace at the same time and see how different studies are performing.
Playback entire markets
You can combine Scanner windows and Playback to practice filtering through many updates and finding opportunities.
Data playback in Market Scanner
Since indicators can be easily applied in the Scanner windows, traders often unite their symbols into groups and filter according to criteria presented by indicators they insert. Once an opportunity presents itself, it's easy to open a chart through a right-click and look more closely at the action, or place an order. Data replay in the Scanner can help practice catching those moments of opportunity when certain symbols are prime for trading.
Play several symbols at once
Ability to playback charts with multiple data series is very important. All symbols will be precisely synchronized according to time, so you get an exact picture of how data arrived throughout the day. Let’s say you have several symbols, even from different data providers, all on the same chart. You want to see how their price movements correlate to each other. This opens up new possibilities of analysis, new insight.
MultiCharts